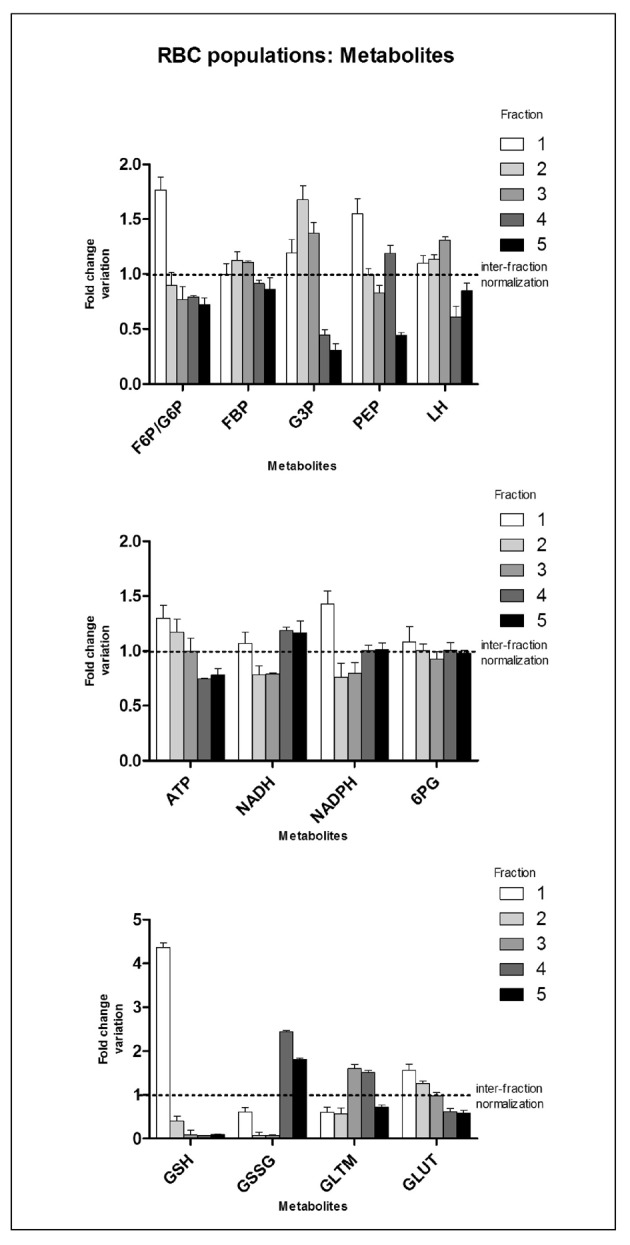
Figure 4.

Time-course metabolomic analyses of leucocyte-filtered RBC subpopulations after separation through a Percoll density gradient. Internal normalisation was performed against the average values for each metabolite among the five distinct subpopulations for all the tested individuals (results are plotted as means+SD). Abbreviations: F6P/G6P=fructose/glucose 6-phosphate; FBP=fructose 1,6 biphosphate; G3P=glyceraldehyde 3-phosphate; PEP=phosphoenolpyruvate; LH=lactate; ATP=adenosine triphosphate; NADH=reduced nicotinamide adenine dinucleotide; NADPH=nicotinamide adenine dinucleotide phosphate; PG=6-phosphogluconate; GSH=reduced glutathione; GSSG=oxidized glutathione; GLTM=glutamine; GLUT=glutamate.
