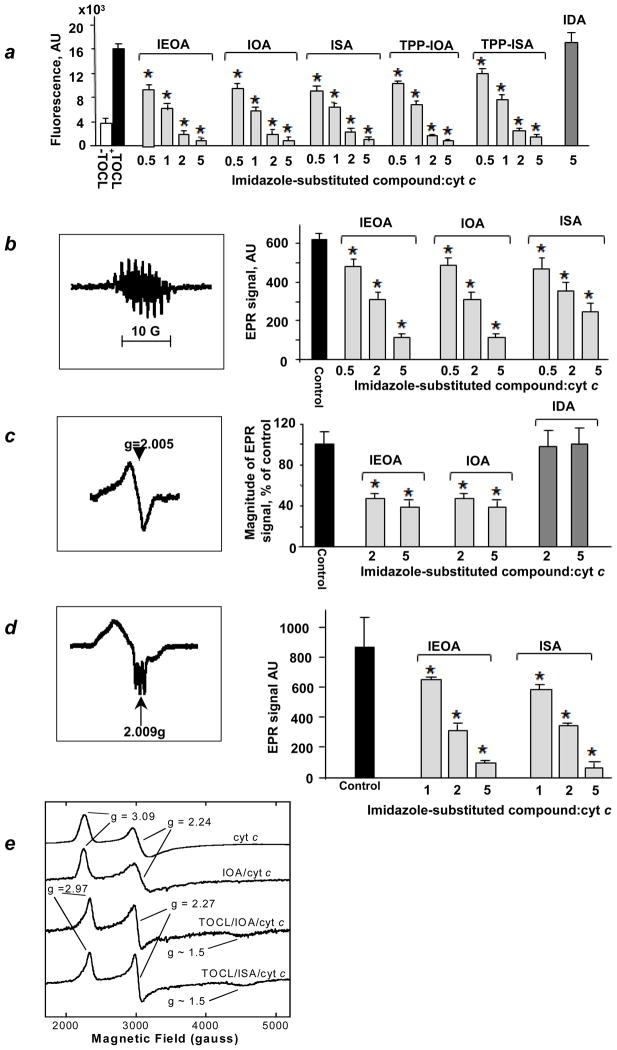
Figure 3. Inhibition of peroxidase activity of cyt c/TOCL complexes.
(a) Assessments of peroxidase activity of cyt c/TOCL by H2O2-induced oxidation of Amplex Red to resorufin. Data are means ± S.D., n = 4, *p<0.01 (Student’s t-test) vs control (TOCL/cyt c/H2O2 with no ISA or IOA or IEOA or TPP-IOA or TPP-ISA added). (b) A typical EPR spectrum of etoposide phenoxyl radicals (left panel). Assessments of peroxidase activity of cyt c/TOCL by H2O2-induced oxidation of etoposide using EPR spectroscopy (right panel). (c) A typical low temperature EPR spectrum of protein-immobilized (tyrosine) radicals (left panel). Assessments of protein-immobilized (tyrosine) radicals by low temperature (77 K) EPR spectroscopy (right panel). (d) ISA and IEOA limit accessibility of heme to small molecules. A typical low temperature (77 K) EPR spectrum of cyt c/TOCL complexes in the presence of Angeli’s salt (left panel). Effects of ISA and IEOA on heme-nitrosylation of cyt c/TOCL induced by nitroxyl (HNO) generated from Angeli’s salt (right panel). Data are means ± S.D., n=3, *p<0.05 vs control (no ISA and IEOA added). (e) Liquid-He EPR evidence for ligation change in cyt c heme-iron. X-band liquid-He (20 K) EPR spectra of cyt c.

