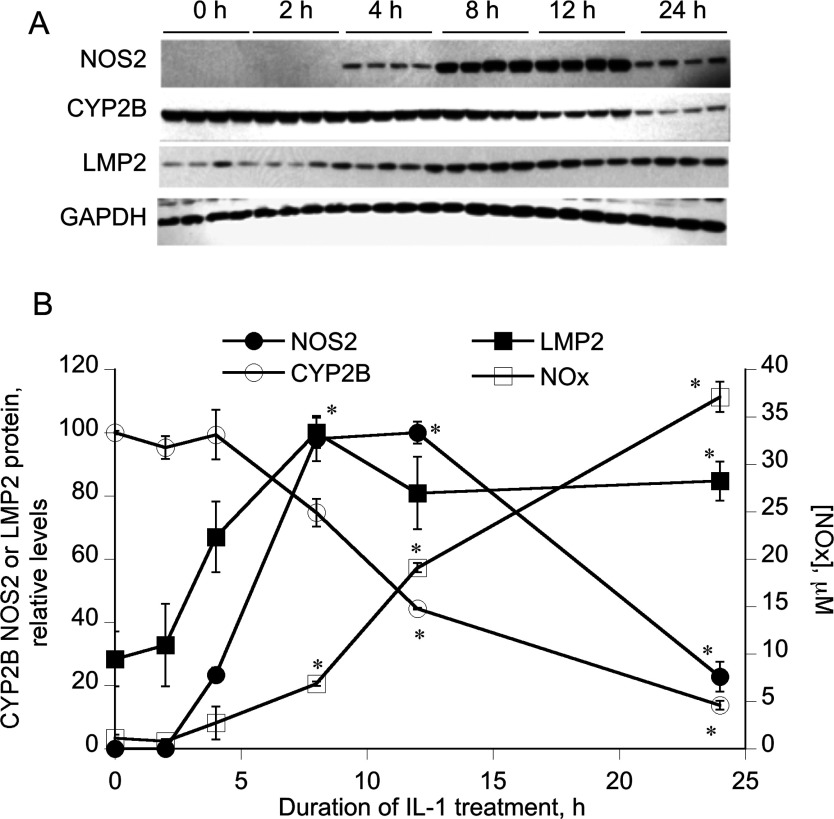
Figure 1. Kinetics of NOS2 and LMP2 induction, NO production and CYP2B down-regulation by IL-1.
Hepatocytes (4 days old) were pretreated with 1 mM PB, which was present for the rest of the experiment. After 48 h, the cells were treated with IL-1 (5 ng/ml) for the indicated times. Cell media and cells were harvested and cell lysates were prepared. (A) Western blots of NOS2, LMP2, CYP2B and GAPDH in gels with identical loads of cell lysates. (B) Quantitative analysis of the Western blot data, as well as NOx concentrations in the medium. Values are means±S.E.M. normalized to the GAPDH signals, and protein levels are expressed relative to the highest detected level for NOS2 and LMP2 and to the zero time control for CYP2B. *P<0.05 compared with the zero time point, one-way ANOVA and Dunnett's test.

