
Fig. 1.
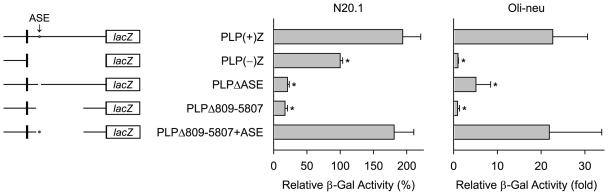
Transfection analysis of Plp-lacZ constructs in N20.1 and Oli-neu cells. Left: Schematic depiction of the Plp1-lacZ constructs used in this study (black boxes portray Plp1 exon 1 and the first 37 bp of exon 2). The star portrays the ASE sequence in Plp1 intron 1. Regions of Plp1 intron 1 DNA missing from the Plp1-lacZ constructs are indicated by the absence of a line. PLP(+)Z contains the entire intron, whereas PLP(−)Z is missing the intron altogether. Right: Transfection results represent the mean ± SD of β-gal activity (n ≥ 6) relative to PLP(−)Z, which was arbitrarily set at 100% (N20.1 cells) or 1-fold (Oli-neu cells) in every experiment. *Significant difference (p < 0.05) between PLP(+)Z and other constructs by one-way ANOVA with Tukey’s post-hoc analysis.