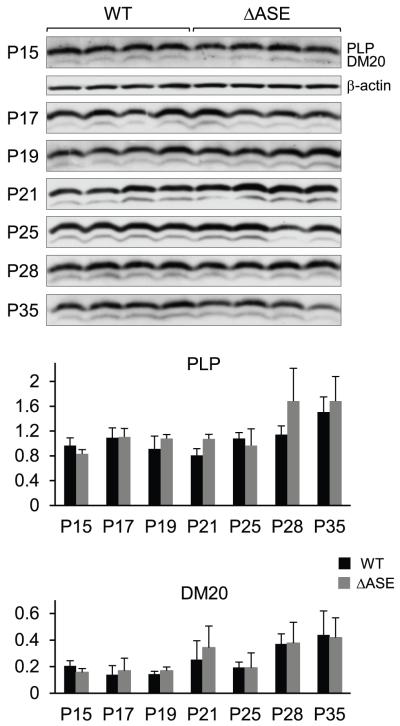
Fig. 5.
Western blot analysis of Plp1 gene products in brain from WT and ΔASE male mice at P15-P35 of age. Protein was isolated from whole brain of mice at the indicated ages, and the relative levels of PLP and DM20 protein determined using an antibody that recognizes both isoforms. Four animals were evaluated for each timepoint/genotype. Blots were incubated first with an anti-PLP/DM20 antibody, and then stripped and incubated with an anti-β-actin antibody. Autoradiograms for PLP and DM20 are shown at the top for all timepoints; only the P15 timepoint is shown for β-actin due to space constraints. Plots represent the mean ratio ± SD of PLP or DM20 to β-actin (n = 4) for each timepoint/genotype by PhosphorImager analysis. No significant difference was noted between the levels of PLP or DM20 in WT and ΔASE mice.

