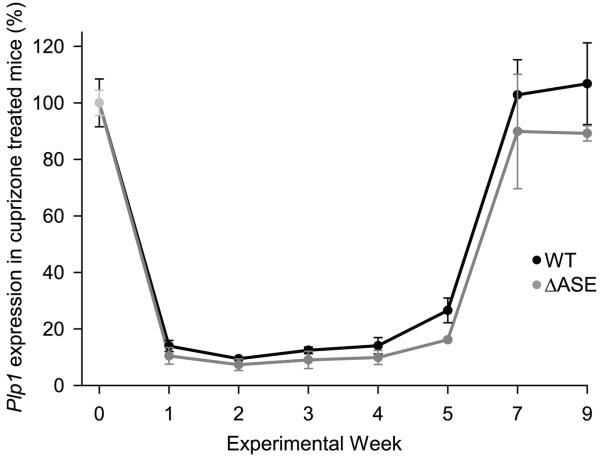
Fig. 6.
Cuprizone-induced changes in Plp1 gene expression in WT and ΔASE mice. Mice at 8 weeks of age (week 0) were placed on a diet containing 0.2% cuprizone for up to 6 weeks (week 0-6) and then switched back to normal rodent chow for the remainder of the study. Untreated mice (not exposed to cuprizone) were also analyzed for both genotypes (WT and ΔASE). Animals were sacrificed at weekly intervals, and total RNA isolated from a defined block of tissue from the corpus callosum (see methods for more details). Real time qRT-PCR analysis was performed, and mRNA levels for Plp1 (Plp and Dm20 combined) and β-actin were determined from a standard curve generated with the same uniform control as in Fig. 4. The ratio of Plp1 (Plp and Dm20 combined) to β-actin mRNA was calculated for each sample, for standardization. Normalized values for Plp1 in untreated mice (no cuprizone) were averaged across all timepoints and set at 100% for a given genotype (WT or ΔASE). Results are plotted as the mean value ± SD of corrected Plp1 in cuprizone-treated mice relative to the average amount in untreated mice across all timepoints for a specific genotype (n = 3 for each timepoint/genotype).

