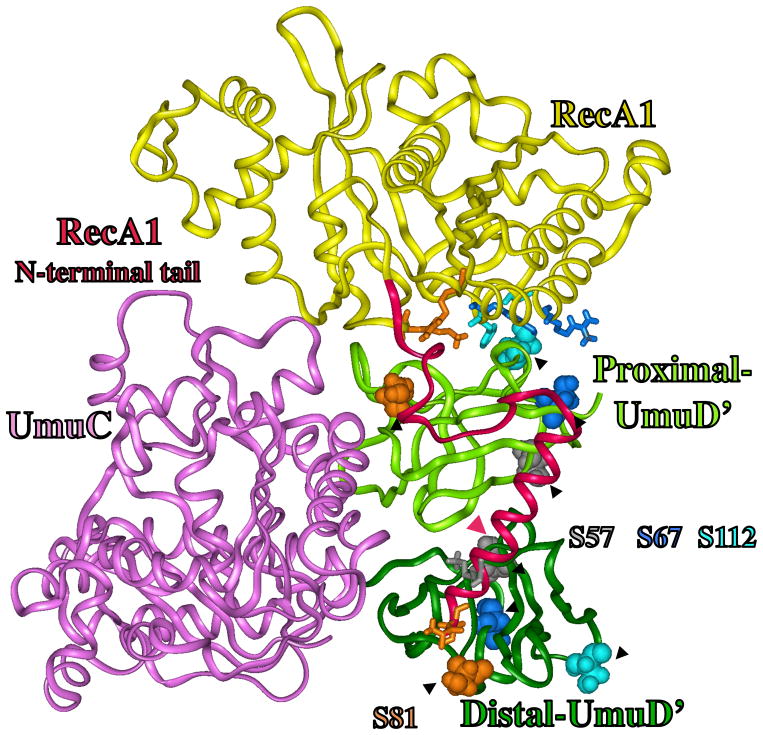
Figure 6.
Close up of UmuD′2C/RecA, which is the active form of DNAP V, as derived from the model in Figure 1B (Mode 2). The N-terminal tail of RecA1 (aa1-38, scarlet) is shown to be in contact with UmuD′ and is close to S56, S67, S81 and S112 (red), as suggested by published findings [88]. RecA1 residues, which are closer than 9Å to S56, S67, S81 and S112 of UmuD′, are shown as sticks in a color-coordinated fashion (see text).

