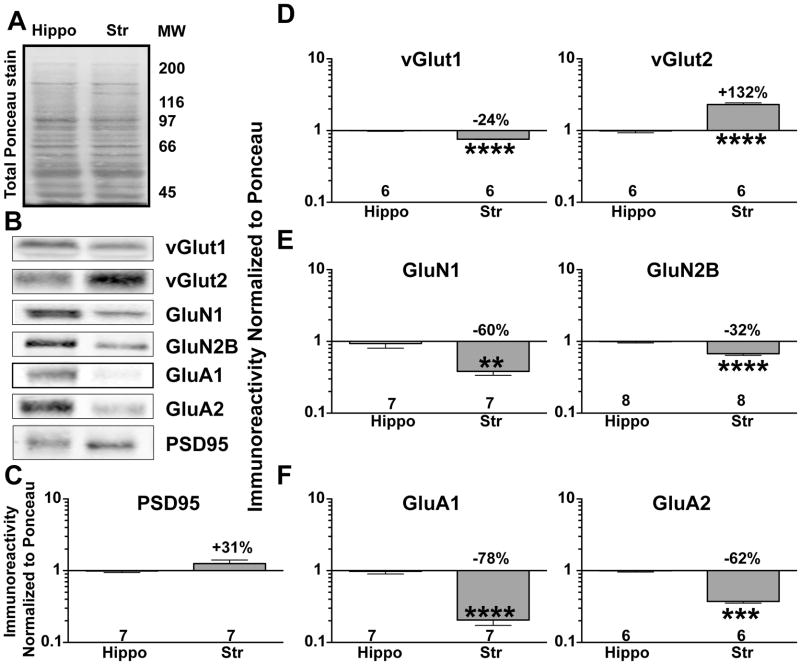
Figure 1. Differential expression of excitatory, synaptic proteins in striatum and hippocampus.
A. Total hippocampal (Hippo) and striatal (Str) proteins stained using Ponceau S. MW -Molecular weight ladder.
B. Representative immunoblot of total hippocampal and striatal lysates for PSD-95, vGlut1, vGlut2, GluN1, GluN2B, GluA1, and GluA2.
C–F. Immunoreactivity for each protein was normalized to total protein loading (Ponceau S stain) and plotted as the striatal:hippocampal ratio on a Log10 scale (see Methods) C. PSD95.
D. vGlut1 and vGlut2. E. NMDAR GluN1 and GluN2B subunits. F. AMPAR GluA1 and GluA2 subunits. An unpaired Student’s t-test was performed between groups. **P<0.01, ***P<0.001, ****P<0.0001.

