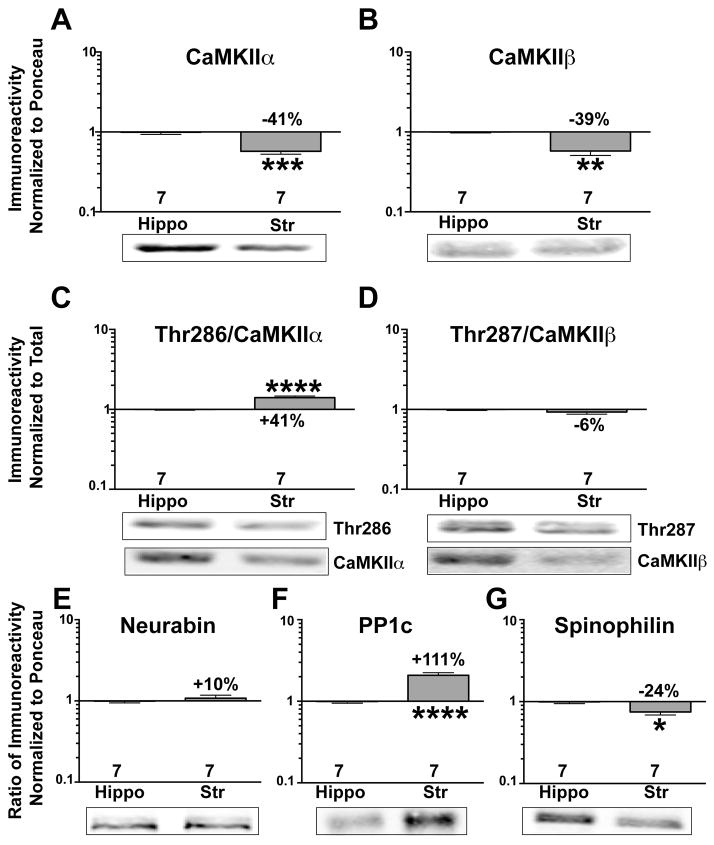
Figure 2. Differential levels and autophosphorylation of synaptic signaling and scaffolding proteins in adult striatum and hippocampus.
Representative immunoblots of hippocampal or striatal lysates from adult mice for CaMKIIα (A), CaMKIIβ (B), phospho-Thr286 (C) phospho-Thr287 (D), neurabin (E), PP1c (F), and spinophilin (G). Immunoreactivity was normalized to either total protein (Ponceau S) stain (A,B, E–G) or to total CaMKII levels (C, D), and plotted as the striatal:hippocampal ratio on a Log10 scale (see Methods). An unpaired Student’s t-test was performed between groups. *P<0.05, **P<0.01, ***P<0.001, ****P<0.0001.

