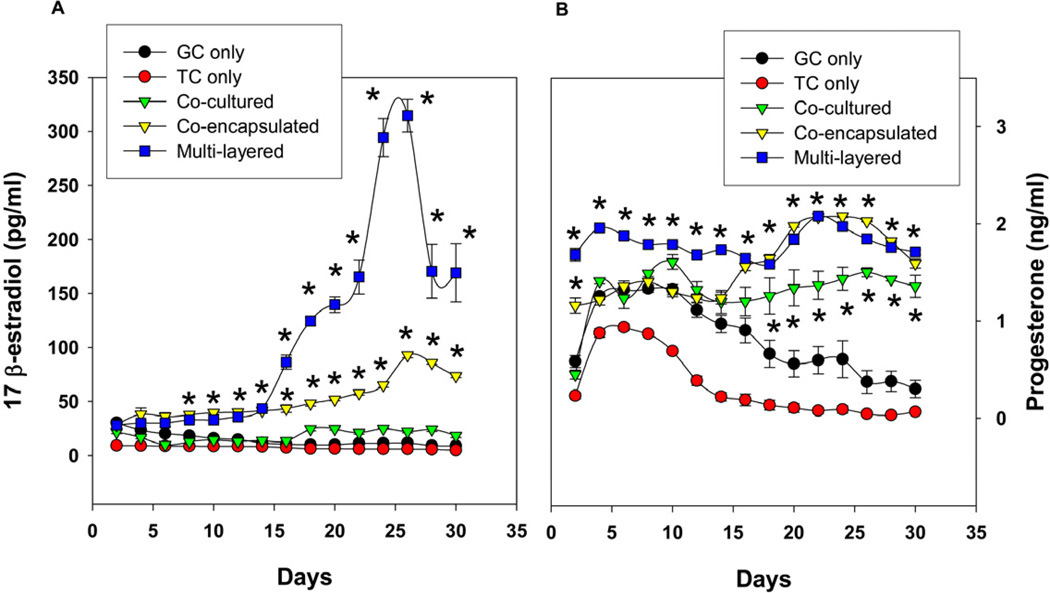
Fig 5.
Sustained E2 (A) and P4 (B) secretion by granulosa and theca cells encapsulated using three different schemes. In contrast to 2-D cultures, E2 levels are maintained or increased with time and the presence of both GC and TC (either through Schemes 1, 2, or 3) led to increased levels of E2 production compared to GC or TC alone. Multi-layer cultures led to significantly increased levels of E2 production. Each data point represents mean ± SEM of 6 values (3 wells/group assayed in duplicates). * denotes statistical significance at P <0.05 compared to granulosa and/or theca cells alone. The figures represent data from one of two separate experiments.

