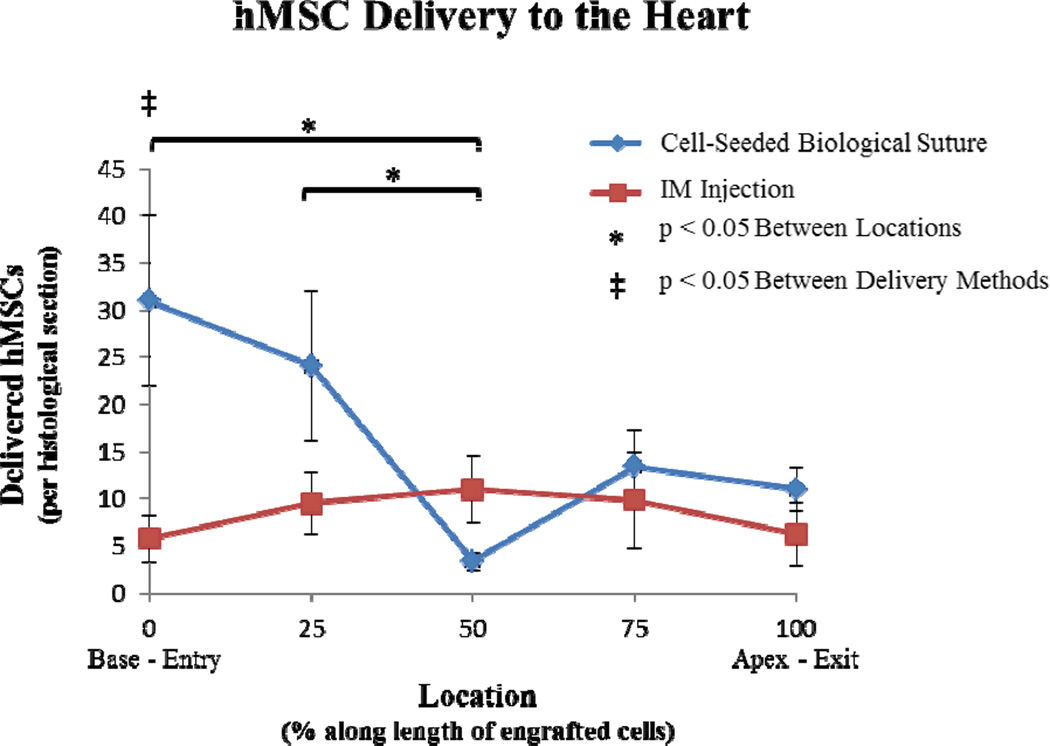
Figure 5. Distribution of delivered hMSCs.
Distributions of delivered hMSCs were compared between cell-seeded suture implantation and IM injection. The cell delivery areas were divided into 5 regions (0, 25, 50, 75, and 100%). For the cell-seeded sutures, 0% corresponded with the entry site and 100% corresponded with the exit site. For IM injections, 0% denoted the first QD-loaded cells identified at the base of the heart and 100% denoted the last QD-loaded cells found at the apex of the heart. Cells were found over 0.55 ± 0.06 cm for the biological suture group and 0.33 ± 0.13 cm for the IM injection group. For cell-seeded sutures, both the 0% and 25% regions contained significantly more cells than the 50% region. Comparing delivery methods at different locations, the cell-seeded suture modality delivered significantly more cells to the 0% entry-site region compared to IM injection.

