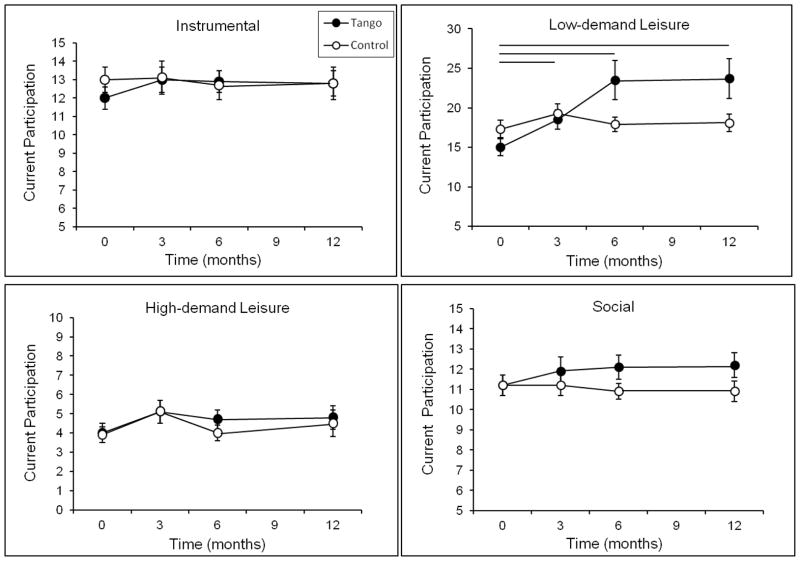
Figure 3.
Current Participation scores on the Activity Card Sort (ACS) for each activity domain at baseline, 3-, 6-, and 12-month evaluations for the Tango and Control groups. Values are means ± SEs. Horizontal lines indicate a significant difference within the Tango group between the time points spanned by the line.

