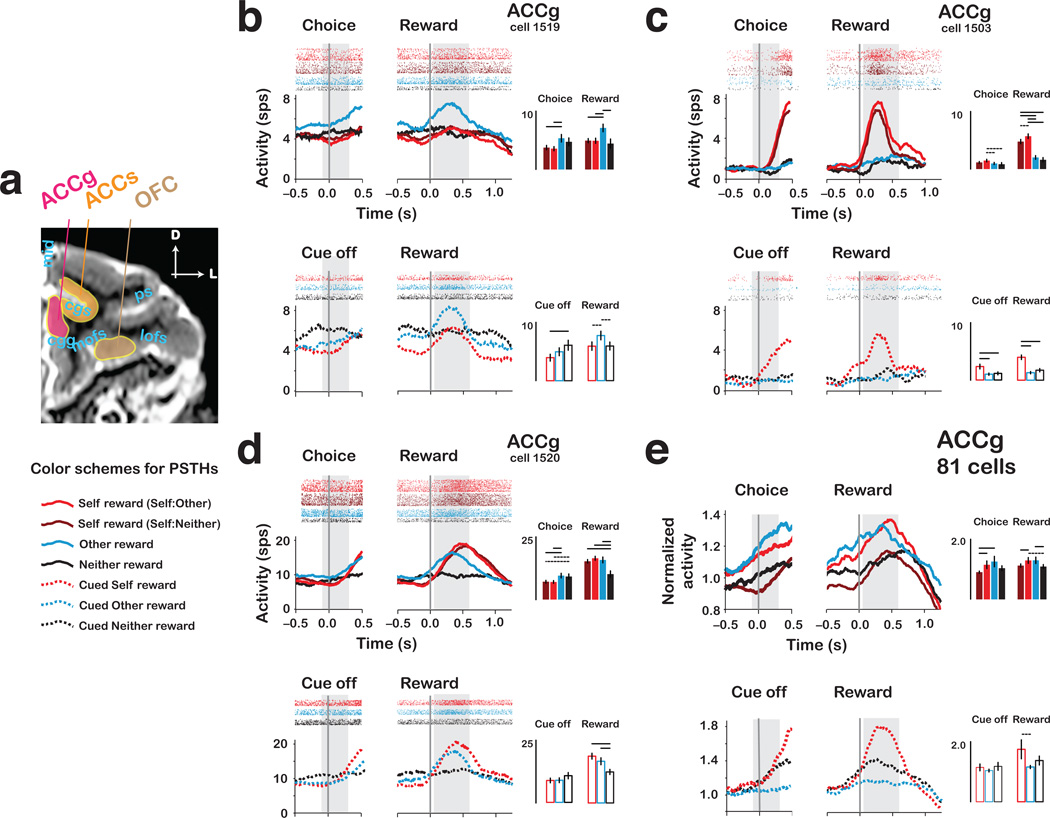
Figure 3.
Single neurons and population responses from ACCg. (a) Structural magnetic resonance image from actor MO, with example electrode paths for ACCg, ACCs and OFC. (Also see Fig. 6.) (b) Mean responses (peri-stimulus time histograms [PSTHs]) and spike rasters for an other-reward preferring ACCg neuron, on choice trials (upper, solid traces) and cued trials (lower, dashed traces). Data are aligned to choice/cue offset (left) and reward onset (right) for each reward outcome. Bar histograms on right show mean ± s.e.m. activity from the two epochs (grey regions). Color codes for PSTH traces and histograms shown below. (c) PSTHs and spike rasters for a self-reward preferring ACCg neuron. (d) PSTHs and spike rasters for a shared self and other reward preferring ACCg neuron. (e) Normalized choice/cue epoch and reward epoch responses for 81 ACCg neurons. c–e, same format as in b. In all bar histogram insets, the horizontal lines above different conditions indicate significance differences (solid, P < 0.05 by paired t-test; dashed, P < 0.05 by bootstrap test).

