
Fig 2.
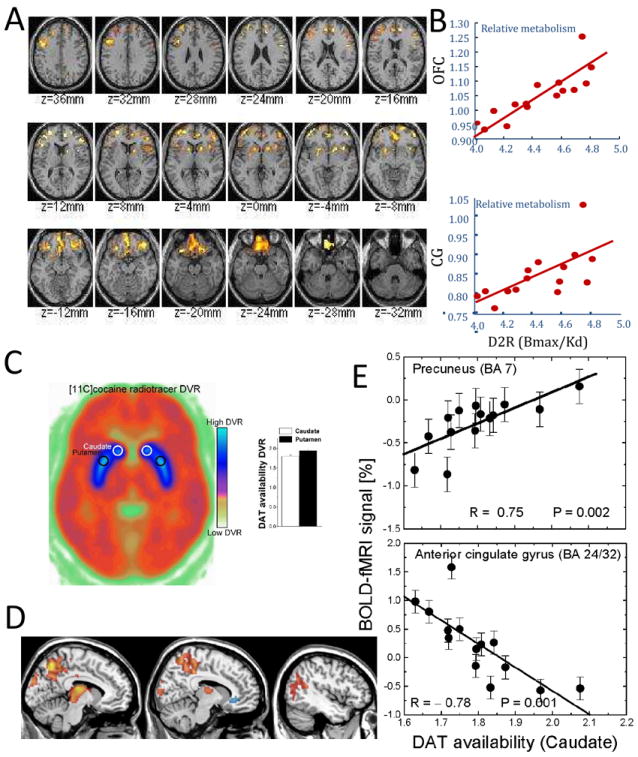
Association between brain metabolism and DA neurotransmission: (A) Statistical axial maps of correlations between relative glucose metabolism and DA D2 receptors (D2R) in the striatum for subjects with a family history of alcoholism and (B) scatter plots exemplifying the linear association between relative metabolism in orbitofrontal cortex (OFC) and cingulate gyrus (CG) (vertical axis) and D2R in the striatum [data from (Volkow et al., 2006)]. Association between brain activation and DA neurotransmission: (C) Axial PET image at the level of the striatum (blue) showing the average availability DA transporters (DAT); (D) the correlation between DAT in striatum and fMRI activation during a visual attention task in 14 healthy humans; and (E) scatter plots exemplifying the correlation of DAT in striatum with the fMRI activation in precuneus and deactivation in ACC [data from (Tomasi et al., 2009a)].