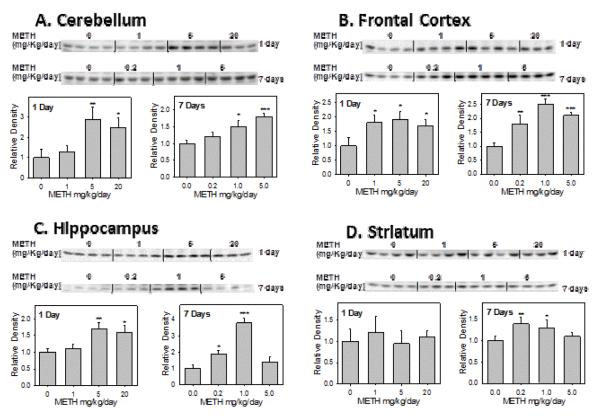
Figure 3.
Representative Western blot and densitometric analysis of rat SULT2A1 in male rat cerebellum (A), frontal cortex (B), hippocampus (C), and striatum (D) after 1 day and 7 days treatment with varying doses of METH.
Values were divided by the smallest densitometric value of the blot. The division factors are plotted and expressed as relative densities. Four animals were used in each group of the treatment and each experiment was repeated twice. *p<0.05; ** p <0.01; and*** p <0.001.

