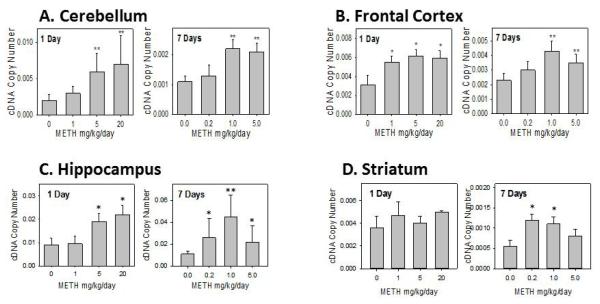
Figure 4.
Rat SULT2A1 mRNA expression in male rat cerebellum (A), frontal cortex (B), hippocampus (C), and striatum (D) after 1 day and 7 days treatment with varying doses of METH.
Relative copy number of rat SULT2A1 mRNA were standardized by using rat β-actin mRNA. Induction fold was calculated by dividing the copy number of rat SULT2A1 mRNA in METH-treated rats by the copy number of corresponding rat SULT2A1 mRNA in control rats. Four animals were used in each group of the treatment and each experiment was repeated twice. *p<0.05; and ** p <0.01.

