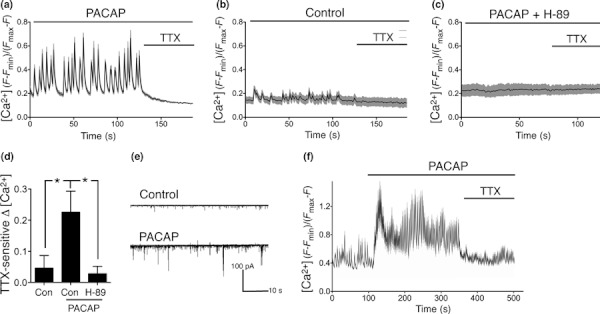
Fig. 1.

PACAP enhances AP firing in cortical neurons. (a–d) Pre-treatment with PACAP (10 nM PACAP-27 here and throughout the study) causes an increase in AP firing-dependent Ca2+ transients. Neurons were treated where indicated with PACAP ± H-89 (10 μM). After 2 h, the neurons were subjected to Fluo-3 Ca2+ imaging studies (see Methods for details) to monitor the size of Ca2+ transients in the different stimulation conditions. TTX (1 μM) was added where indicated to determine the extent to which the observed Ca2+ transients were because of action potential firing. Example traces are shown: black line indicates the mean Ca2+ concentration within a field of cells, and the grey shaded region indicates ± SEM of the Ca2+ concentration within that field. Free Ca2+ concentrations were calculated from fluorescence signal (F) according to the equation [Ca2+] = Kd(F–Fmin)/(Fmax–F), and expressed as a multiple of the Kd of Fluo-3 (which is approximately 315 nM). (d) shows quantification of data shown in (a–c), that is, quantification of the difference in mean amplitude of [Ca2+] before and after 1 μM TTX treatment. In order to quantitate the effect of PACAP on firing activity-induced [Ca2+] influx, the mean [Ca2+] 30 s before and 30 s after TTX treatment was calculated in either control neurons or neurons treated with PACAP ± H-89. For each cell, the degree of TTX-sensitive Ca2+ changes was calculated as the difference between mean [Ca2+] before and after TTX treatment. For each condition, 60 cells were analysed within six independent experiments (*p < 0.05). (e) Example trace of a whole-cell voltage-clamp recording of a control and PACAP-treated cortical neurons. PACAP causes an increase in burst-like activity, consistent with the Ca2+ imaging data. (f) Ca2+ imaging of acute PACAP treatment, a typical example trace is shown representative of six independent experiments.
