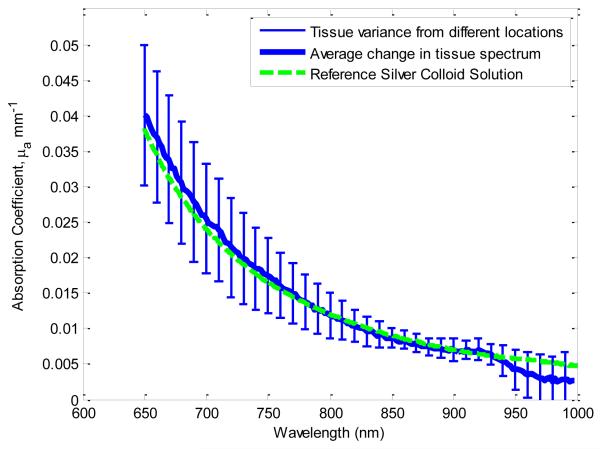
Figure 3.
Averaged site-specific difference spectra in absorption between pre- and post-treatment tissue. The green line represents the independently measured absorption signature of silver colloid in solution. Here the difference spectra match the spectral profile of the silver colloid solution reference, indicating that the change in tissue due to treatment is the targeted removal of silver.

