
Figure 6.
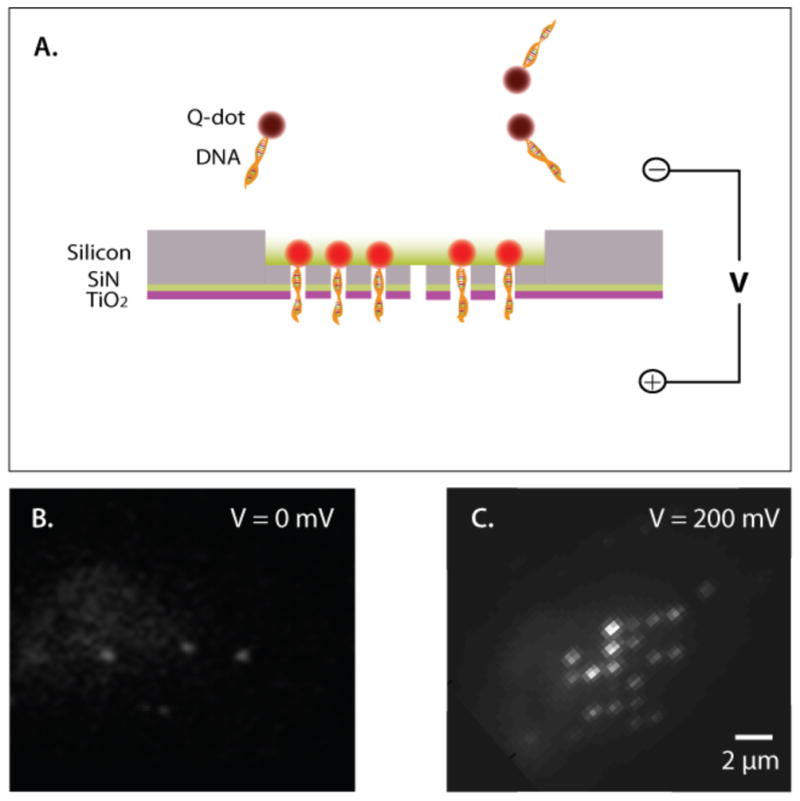
A. Schematic illustration of the TIRF based imaging of the nanopore array and Qdot-DNA conjugates. Bottom: Optical images of the membrane before (B) and after application of a positive voltage (C). The discrete fluorescent spots arise from the Qdots-DNA conjugates, exhibiting partial occupancy of a 6×6 nanopore array when a positive voltage is applied.