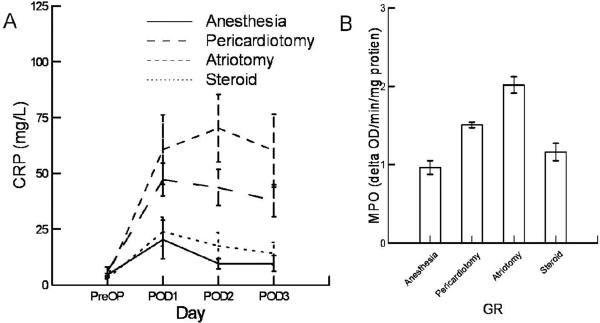
Figure 6.
Panel A shows the serum concentration of CRP for the four days of the study for the four experimental groups. The p values for the time effect and group effect are p<0.001and p<0.001 respectively. Panel B shows the MPO activity for each of the four groups on POD3. The levels were significantly different (p<0.001). The anesthesia group was different from the pericardiotomy (p=0.001) and atriotomy (p<0.001) groups. The anesthesia and steroid group were not significantly different (p=0.034). The steroid group was different from the atriotomy (p<0.001) and pericardiotomy group (p=0.032).

