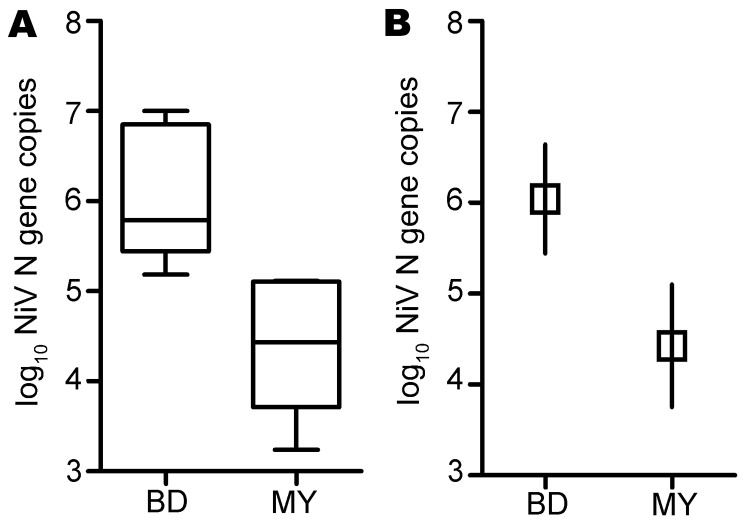
Figure 2.
Oral shedding of Nipah virus (NiV) in experimentally infected ferrets. A) Results of viral RNA area under the curve (AUC) calculation. Lower margin, inner line, and upper margin of the boxes represent 25th percentiles, medians, and 75th percentiles, respectively. Whiskers show maximum and minimum values for each group. B) Comparison of mean AUC between NiV-Bangladesh and NiV-Malaysia. Mean AUC for the NiV-Bangladesh infection group was significantly higher than that for the NiV-Malaysia–infected group; p = 0.001. Interval bars represent 95% CIs for the means. BD, Bangladesh; MY, Malaysia.

