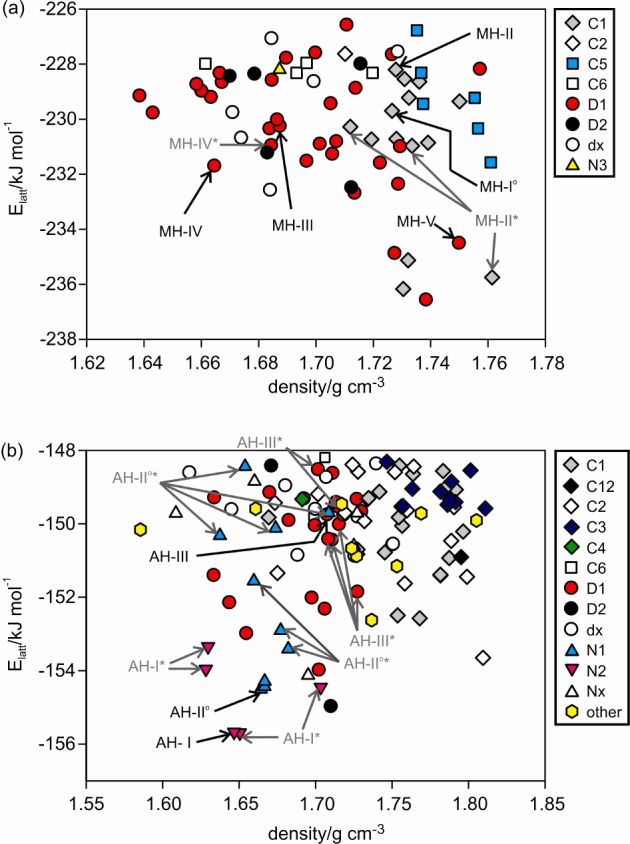
Figure 2.

Crystal energy landscapes for (a) gallic acid monohydrate (Z′ = 1) and (b) anhydrate (Z′ = 1 and 2), classified by the hydrogen-bonding motif (Figure 3). Each symbol denotes a crystal structure. Experimental structures are picked out with black arrows; structures labeled with an asterisk (*) differ from the experimental structure in proton position(s) but not in packing.
