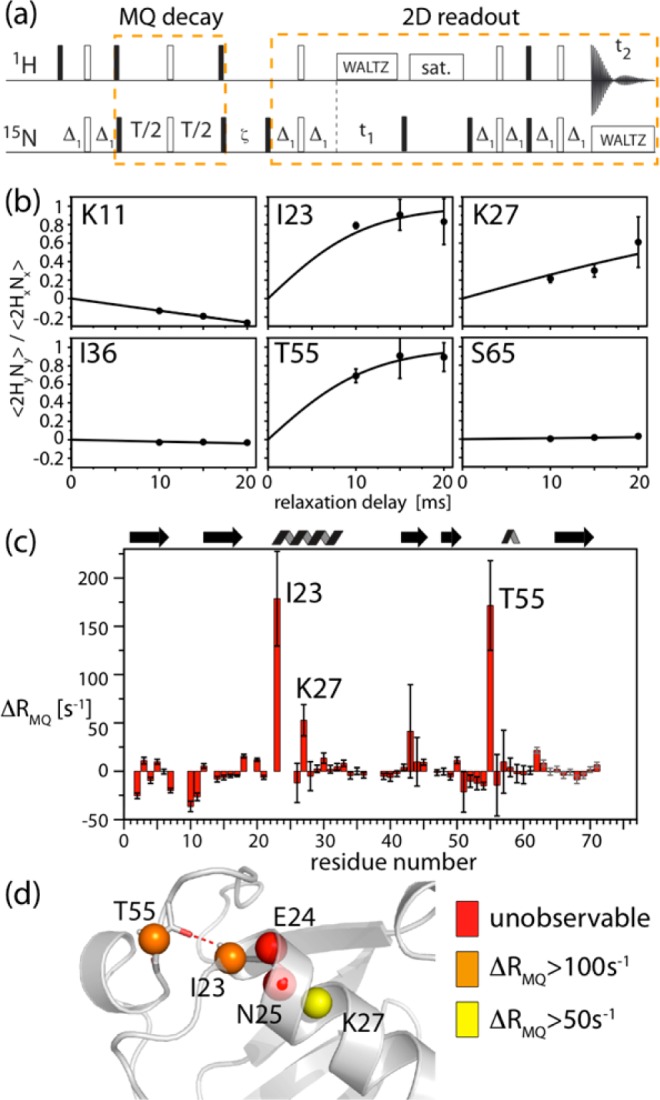
Figure 2.

Measurement of differential multiple-quantum decay rates. (a) Pulse sequence used in this study. Differential zero- and double-quantum line broadening is obtained from separate experiments that probe the coherences, 2HxNx and 2HyNy, respectively, which are selected by setting the phases of the pulses at the end of the MQC evolution delay.9 Details about delays and phase settings are shown in Figure S6 in the Supporting Information. (b,c) Experimental data obtained on a microcrystalline sample of ubiquitin at 300 K: (b) Representative examples of the buildup of 2HyNy from 2HxNx, along with best-fit curves, ΔRMQ = (2 atanh(⟨2HyNy⟩/⟨2HxNx⟩))/T. Error bars were obtained from 2 times the standard deviation of the spectral noise. (c) Fitted residue-wise differential multiple-quantum decay-rate constants ΔRMQ, using three different relaxation delays. Error margins were determined from Monte Carlo simulation based on error bars determined from twice the spectral noise. Residues with particularly large ΔRMQ are indicated. Note that, in principle, a single relaxation delay would suffice to determine ΔRMQ. (d) Residues for which large ΔRMQ are observed (I23, K27, T55) as well as unobservable resonances (E24, N25) in 1H-detected HSQC-type spectra31 are plotted onto the structure. The H-bonding of I23(HN)-R54(CO) is indicated.
