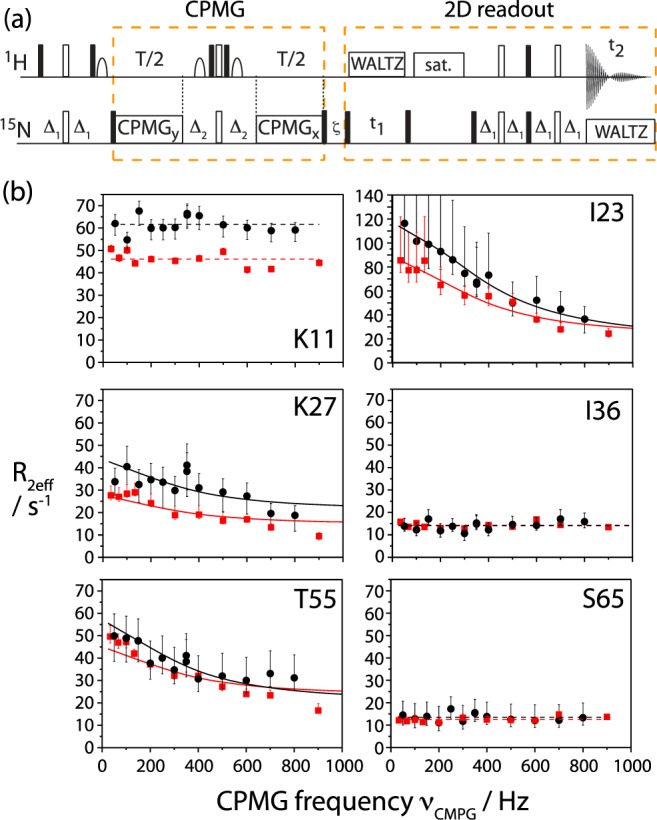
Figure 3.

(a) Pulse sequence used in this study to measure 15N CPMG relaxation-dispersion data on deuterated proteins in the solid state. Details are shown in the Supporting Information. (b) 15N CPMG RD solid-state NMR data obtained on microcrystalline ubiquitin at 300 K sample temperature, collected at a 1H Larmor frequency of 600 MHz (red) and 800 MHz (black). Note the different scale in the data of Ile23. Upper and lower error bars of R2eff were determined from Monte Carlo simulations, based on twice the spectral noise (see Figure S17). For residues I23, K27, and T55, solid lines represent the Bloch–McConnell fit, in other cases lines represent the mean values of the individual data points. Data for all other residues are shown in the Supporting Information.
