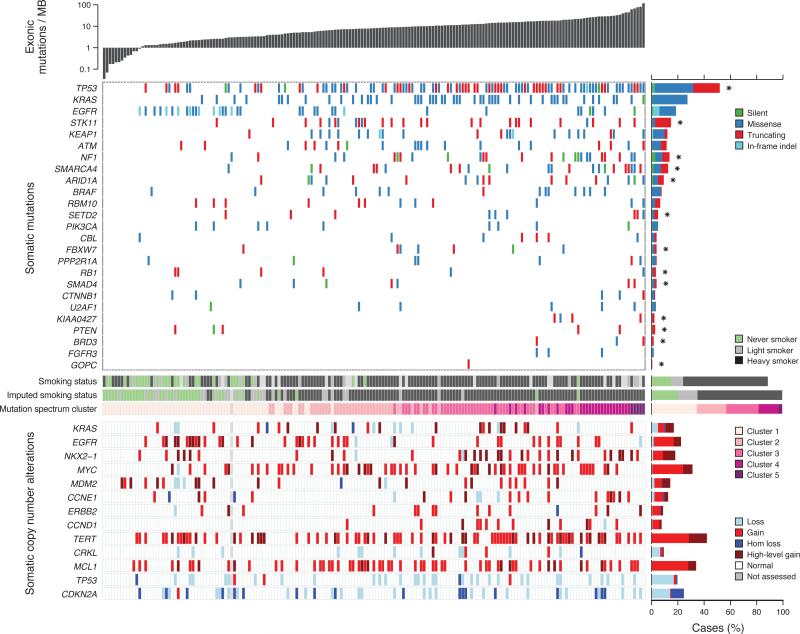
Figure 2. Somatic mutations and copy number changes in 183 lung adenocarcinomas.
Top panel, summary of exonic somatic mutation of 25 significantly mutated genes (see text and Table S3 for details). Tumors are arranged from left to right by the number of non-silent mutations per sample, shown in the top track. Significantly mutated genes are listed vertically in decreasing order of non-silent mutation prevalence in the sequenced cohort. Colored rectangles: mutation category observed in a given gene and tumor. Bar chart (right): prevalence of each mutation category in each gene. Asterisks indicate genes significantly enriched in truncating (nonsense, frameshift) mutations. Middle bars: smoking status and mutation spectrum cluster for each patient. White boxes indicate unknown status. Bottom panel: summary of somatic copy number alterations derived from SNP array data. Colored rectangles indicate the copy number change seen for a given gene and tumor.

