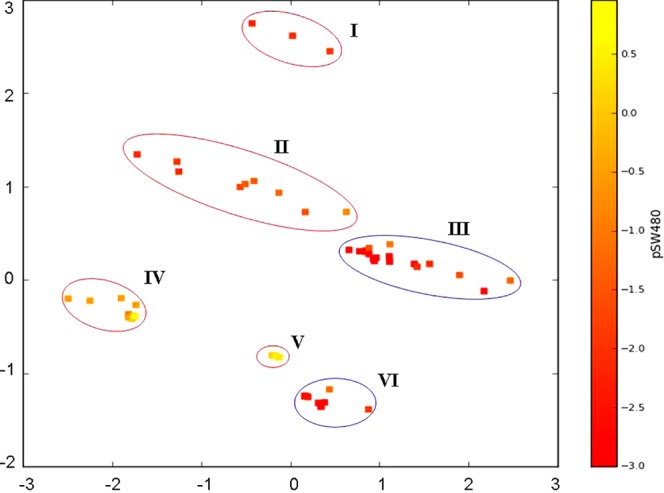
Figure 11.

Score plot derived from PCA using four descriptors (Ei, Eea, Eeas, and Hdon), applied for modeling the cytotoxicity in SW480 cells (model 3): cluster I, compounds with a terminal free CH2OH group in the axial ligands; cluster II, amides and free carboxylic acids from subset 1; cluster III, amides and free carboxylic acids from subset 2 and 17 and 18 from subset 1; cluster IV, esters from subset 1 (without the EtNH2 derivatives); cluster V, esters from subset 1/the EtNH2 derivatives; cluster VI, esters from subset 2.
