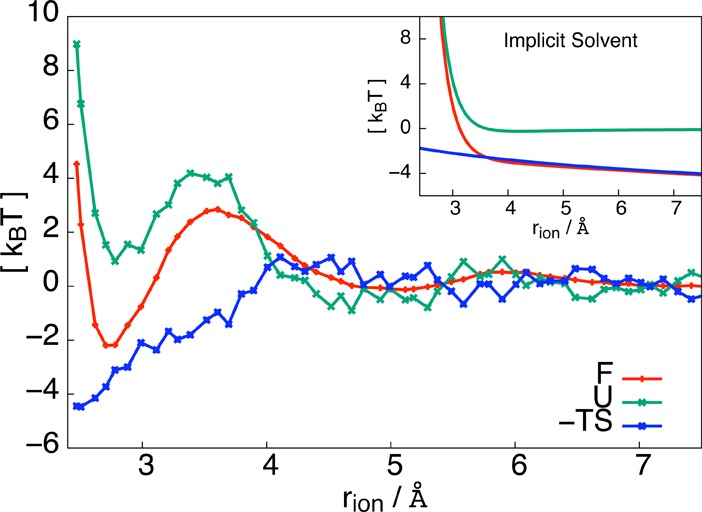
Figure 1.

Thermodynamics of ionic dissociation. The free energy (red) as a function of rion displays a stable associated state at rion = 2.7 Å, separated from the dissociated state by a free energy barrier of 5 kBT. Also plotted are the average energy (green) and negative entropy (blue) as a function of rion. Dissociation is driven energetically and opposed by entropy. The inset shows the free energy, the energy, and the entropic contribution for an implicit solvent model, in which the electrostatic interaction between the two ions is reduced by a factor of ε = 80.
