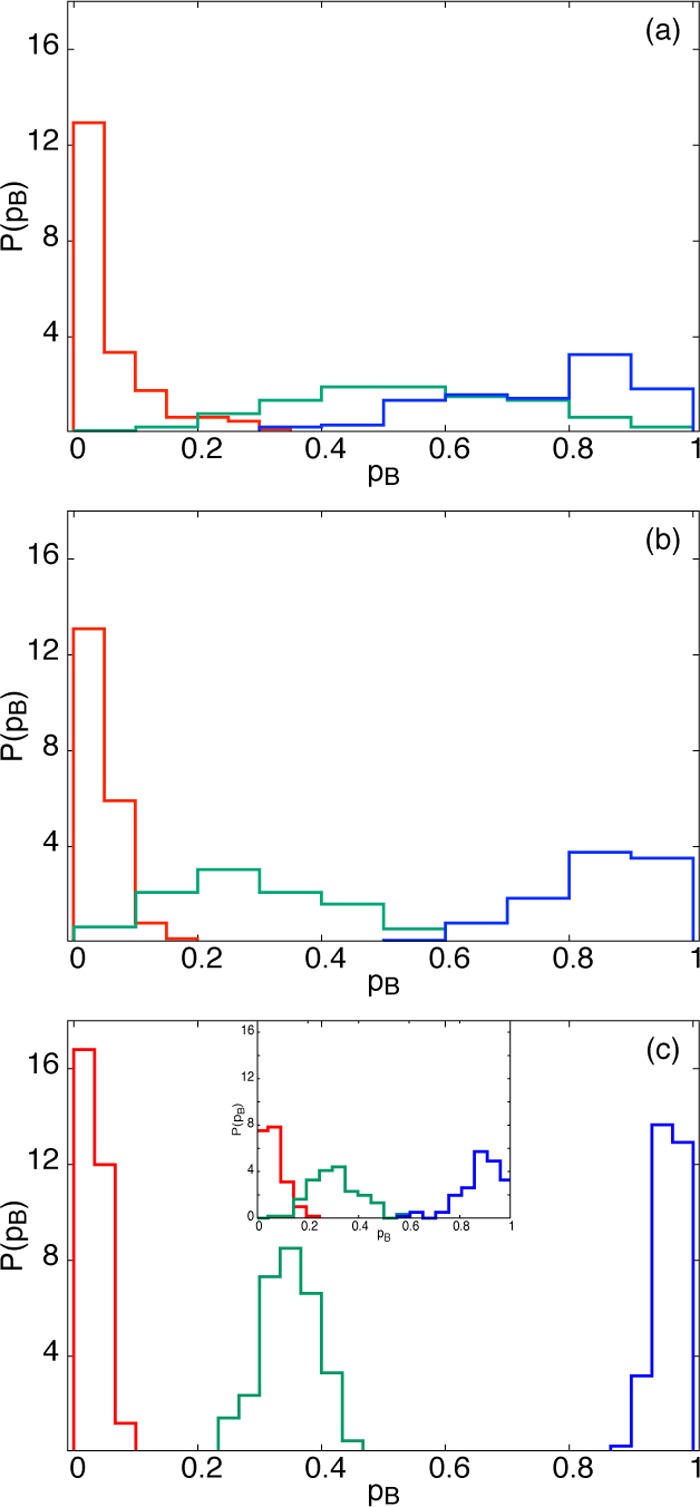
Figure 6.

Committor analysis applied to configurations containing “frozen” (identical) solvent coordinates in (a) the first, (b) the first two, and (c) the first three solvation shells, and properly equilibrated outer shells. In each figure, the colors distinguish between different sets of frozen solvents, chosen near the associated state (red), transition region (green), and dissociated state (blue). When freezing the first three solvation shells on a larger system of N = 905 water molecules, the committor distributions are not as tight (inset of panel), further demonstrating that solvent effects on dissociation are long-ranged.
