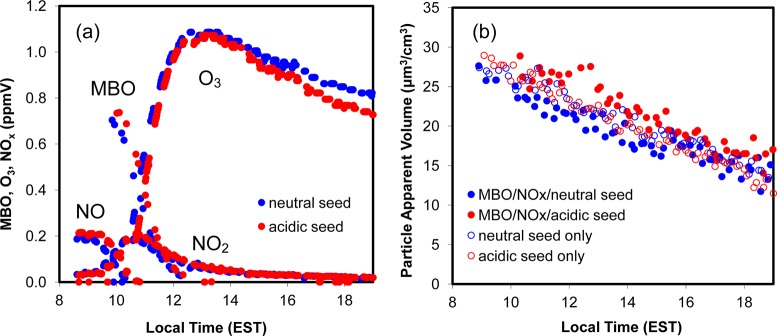
Figure 1.

Online measurement results of the high-NO experiments (UNC1 and UNC2). (a) Time profiles of major gas-phase compounds (MBO, NO, NO2, and O3). (b) Wall-loss uncorrected particle apparent volume concentrations (μm3/cm3). Red solid circle represents the acidic seeded MBO experiment; blue solid circle represents the neutral seeded MBO experiments; the hollow circles in red and blue in (b) represent two control experiments with only acidic and neutral seeds, respectively.
