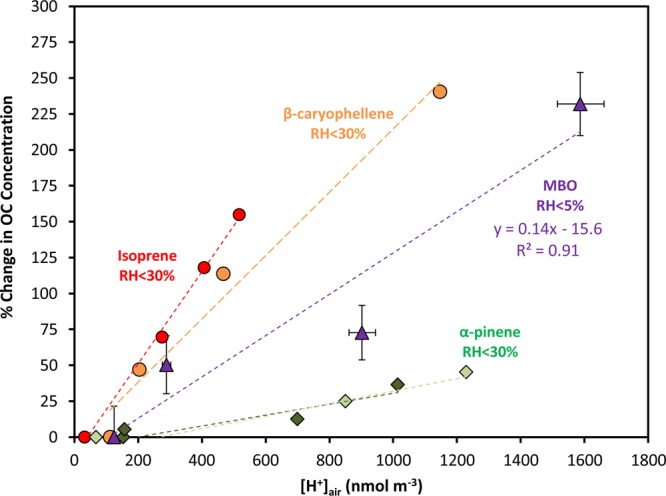
Figure 2.

Relationship between the change (%) of organic carbon (OC, in μg C m–3) and the measured seed aerosol acidity ([H+]air nmol m–3) for different BVOCs. The data for isoprene, α-pinene, and β-caryophellene are reproduced from Surratt et al.23 and Offenberg et al.35 The two green shades of α-pinene data are from two individual experiments with different initial conditions, as described by Offenberg et al.35 The MBO data are from the present study. The determination of the error bars is discussed in the Supporting Information.
