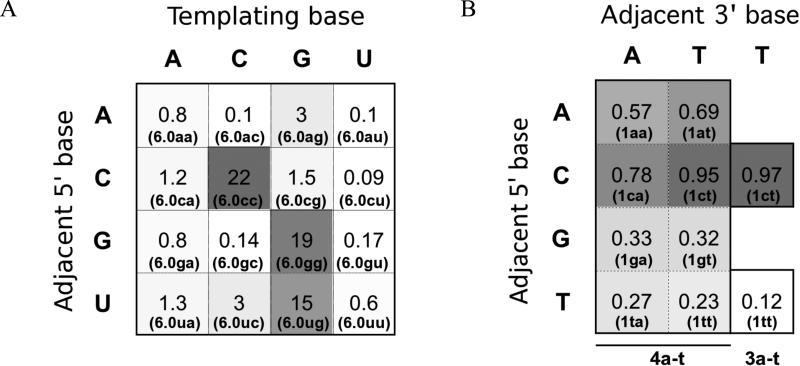
Figure 7. The effect of sequence context on rate (A) and fidelity (B).
Template sequences are from series 6.0 (A) and series 1 (B). The templating base is positioned across from the incoming nucleotide; the adjacent 5′ and 3′ bases are positioned immediately 5′ and 3′of the templating base, respectively. Heat maps are shown with each square shaded according to the relative values given in each square (higher value = darker square), for first-order rate constants (h-1) in (A) or fidelities fG in (B). Template is given in parentheses. Activated monomers are indicated at the bottom of panel B. See Supporting Tables S3-4 for more details.

