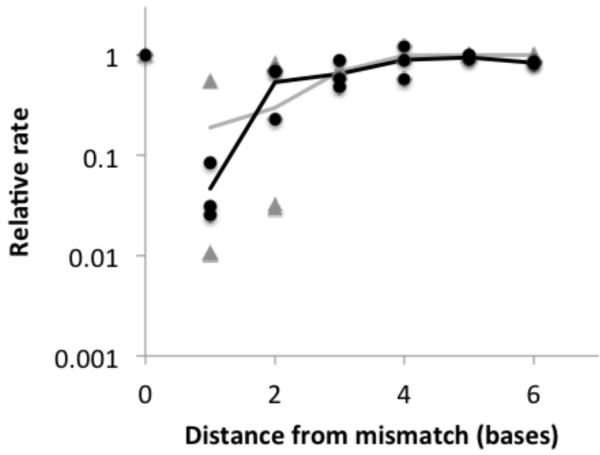
Figure 4. Recovery of extension rate following a single mismatch.
Distance (x-axis) is the number of bases from the mismatch to the end of the primer before reaction, including the mismatch itself (‘0’ is no mismatch; ‘1’ is incorporation immediately after the mismatch, etc). Black circles are experimental values, averaged over replicates, for several primer-template complexes, where the relative rate is k/k0 (k is the observed rate and k0 is the rate with no mismatch). Black line is the average among complexes for experimental values at the same distance. Gray triangles are theoretical values for different primer-template complexes, where the relative rate is equal to (Pckt + Pokn)/kt, where Pc and Po are the probabilities that the base pair is closed or open, respectively, and kt and kn are the rates of templated and non-templated extension, respectively. Gray line is the average among different complexes for theoretical values at the same distance. See Supporting Table S1 for experimental rates and errors.

