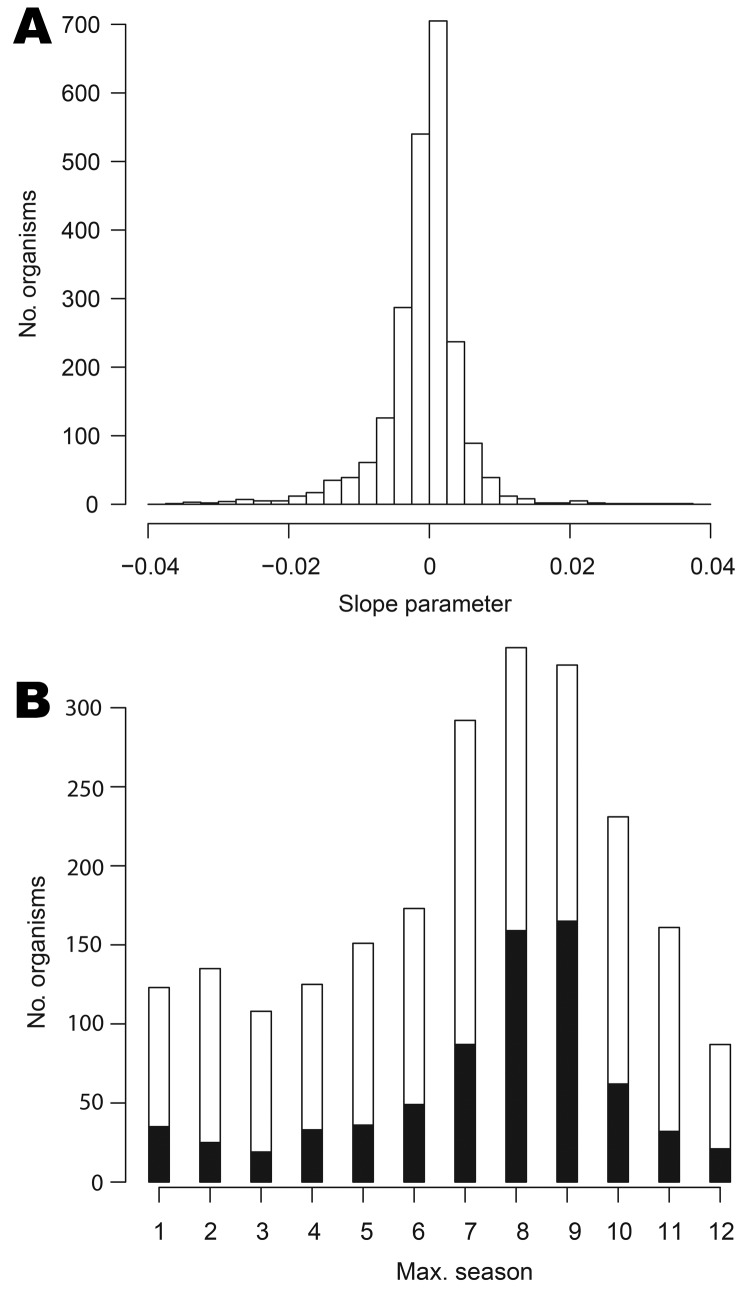
Figure 4.
A) Distribution of estimated linear trend parameters (units: per week) for data on 2,250 organisms (excluding 4 organisms with extreme slopes), England and Wales, 1991–2011. B) Stacked bar chart of modal seasonal period for 2,254 organisms. The black bar sections represent organisms for which the seasonal effect is statistically significant.

