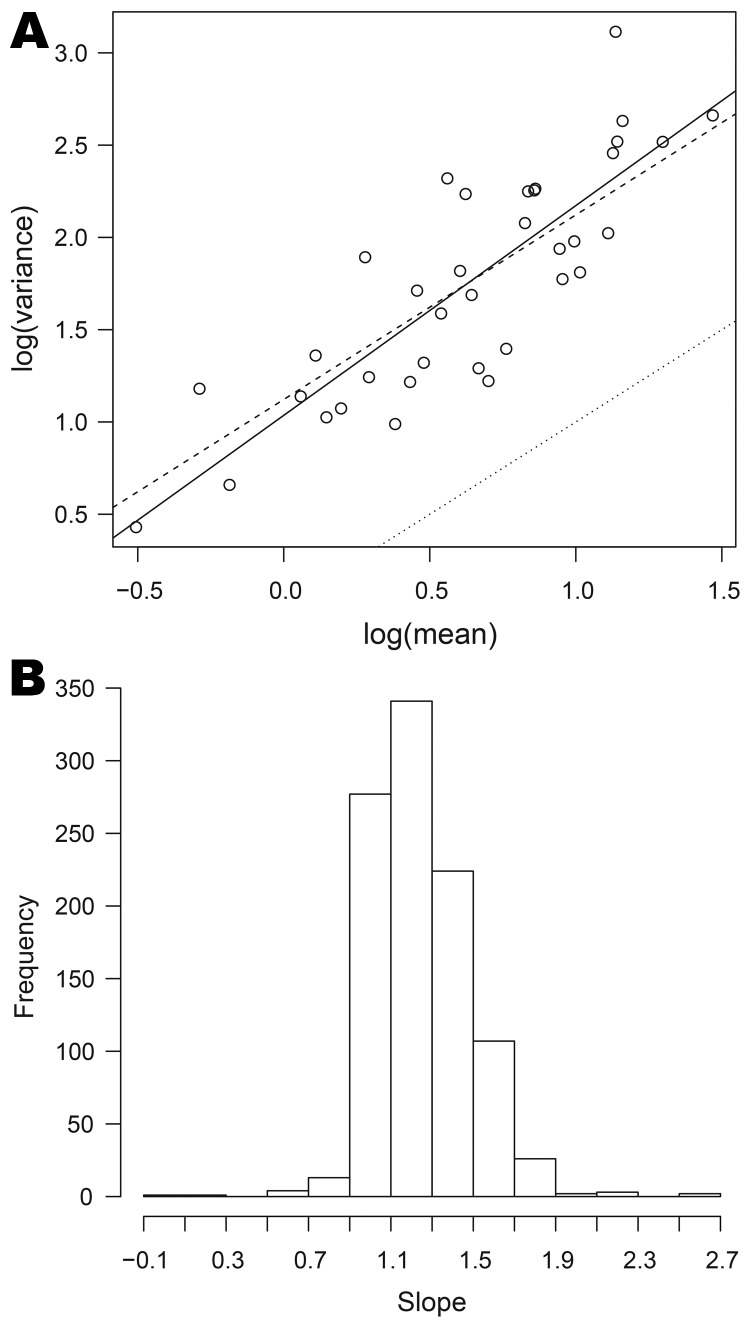
Figure 5.
Relationships between mean and variance for data on organisms collected, England and Wales, 1991–2011. A) The log of variance plotted against log of mean for Cyclospora spp. The full line is the best fit to the points; the dashed line corresponds to the quasi-Poisson model; the dotted line corresponds to the Poisson model. B) Histogram of the slopes of the best-fit lines for 1,001 organisms; the value 1 corresponds to the quasi-Poisson model (equation 1).

