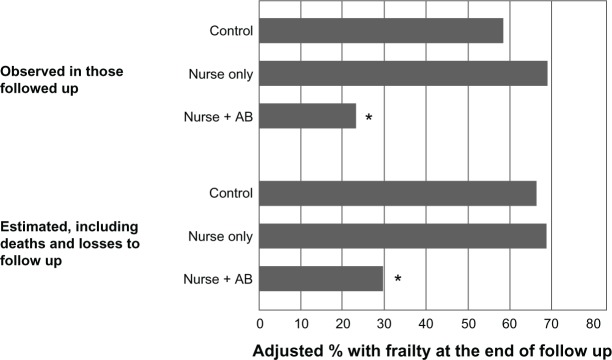
Figure 2.

Percentages of participants with frailty at the end of follow-up in the three study groups.Notes: Percentages presented are adjusted for baseline frailty, sex, marital status, years of school, independence in activities of daily living, cognitive impairment, depression, body mass index category, and score on the role physical and social functioning SF-36 subscales, through logistic regression. Adjusted percentages correspond to the expected frailty proportion of an average participant, in terms of the adjustment variables. *P < 0.05, comparing the NV+AB to the control group.Abbreviations: NV+AB, nurse visits including an alert button; SF-36, 36-item Short-Form Health Survey.
