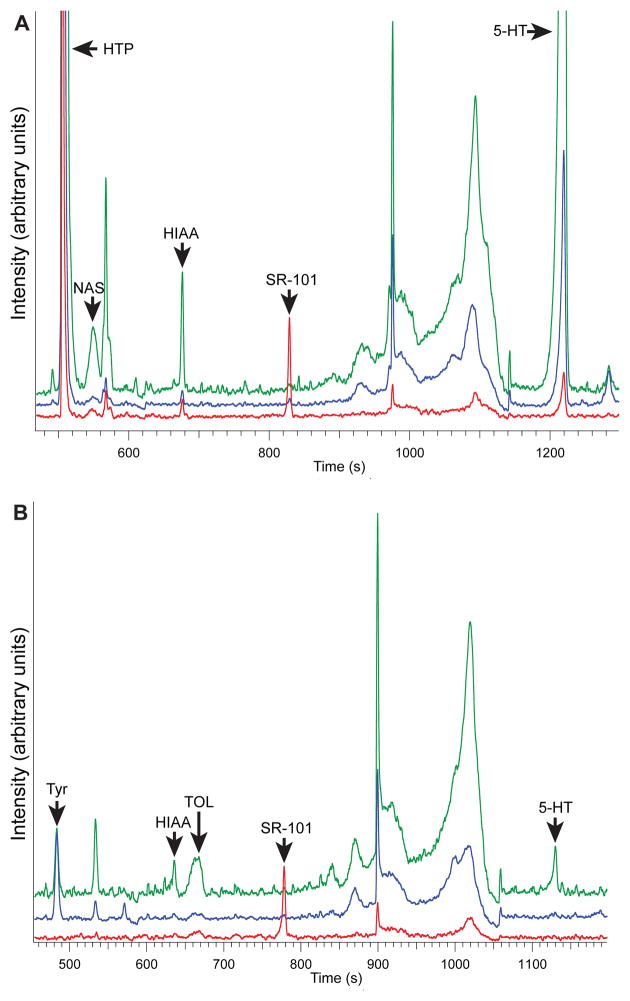
Figure 2.
Electropherograms of a treated and untreated single pinealocyte from the same animal. The green trace represents the signal from PMT green (310–400 nm), the blue trace represents the signal from PMT blue (250–310 nm), and the red trace represents the signal from PMT red (400+ nm). (A) A pinealocyte incubated in 5-hydroxytryptophan. (B) An untreated pinealocyte, with native levels of analytes such as indolamines and Tyr detected. Recordings from all three detection channels are shown. 5-HT = serotonin, HIAA = 5-hydroxyindole-3-acetic acid, HTP = 5-hydroxytryptophan, NAS = N-acetylserotonin, SR-101 = sulforhodamine-101 (internal standard), TOL = tryptophol, Tyr = tyrosine. Conditions are: 15 mM borate buffer, pH 8.8, + 37.5 mM SDS (electrophoresis buffer), high salt mGBSS (sample buffer), 25 mM citric acid buffer, pH 2.25 (sheath buffer), −30 kV (separation voltage), 3 Hz (laser repetition rate), 100 μs (laser pulse length), 8 A (laser current), 420 V (laser BUSS voltage), 470 pF (PMT gain), 64% (gain voltage), 110 μs (PMT integration time).

