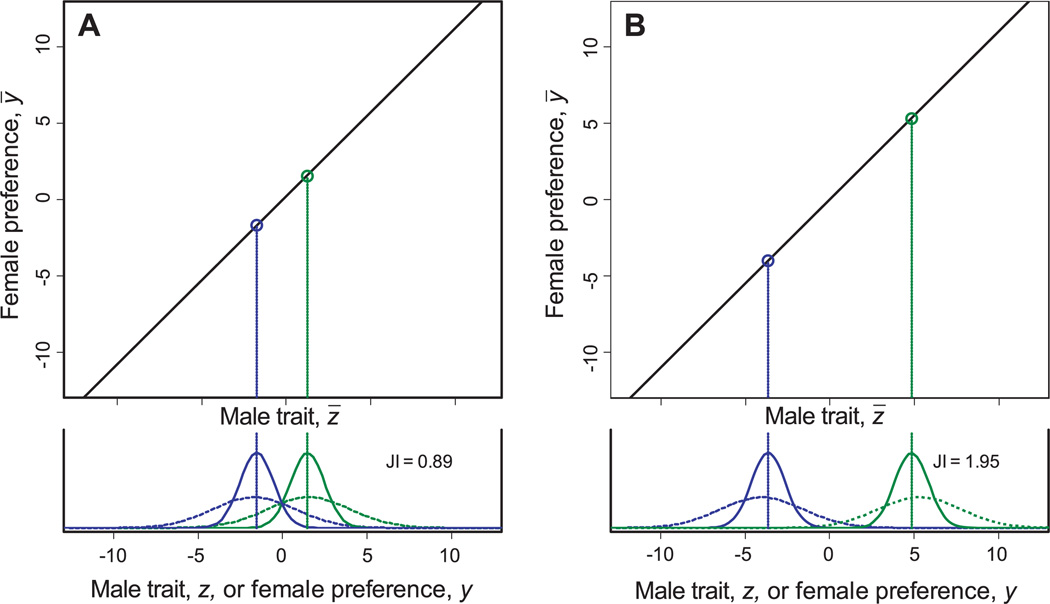
Figure 1.
Sexual isolation between populations that have diverged along the line of equilibrium. The axes represent population means for a male trait and female preference. The upper portion of each graph shows the line of equilibrium predicted by the model. The lower portion of each graph shows the distributions in two independent populations of the male trait (solid lines) and the population-level average female preference (dashed lines). The scale in both portions is in units of within population phenotypic standard deviation of the male trait. (A) Two populations that have experienced modest divergence lie relatively close to each other on the line of equilibrium, resulting in a modest level of sexual isolation (JI = 0.89). (B) The two populations have experienced appreciable divergence, resulting in almost maximal sexual selection (JI = 1.95). Parameter values for this example are: σ2 = 1, τ2 = 1, and ν2 = 5.

