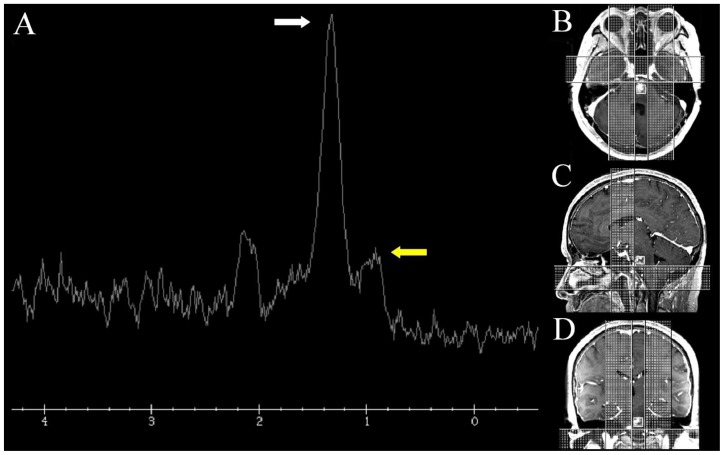
Figure 2.
57-year-old man with radiation necrosis of the pons. Proton MRS (2A) of the pontine lesions (TE 35ms) shows a dominant peak at 1.33ppm (white arrow) and an abnormal peak at 1.0ppm (yellow arrow) representing lactate and lipids respectively. Notably, peaks representing n-acetylaspartate (2.0ppm), choline (3.2ppm) and creatine (3.0ppm) are greatly reduced. Localization (white box) MP-RAGE images (2B-D) taken from the series shown in figure 1D-F. (1.5 Tesla, A: TR 8.4ms, TE 2.6ms, slice thickness 1.6mm. B-C: TR 8.4ms, TE 2.6ms, slice thickness 1.5mm, D: TE 35 ms, A-C 10mL of gadopentate dimeglumine (Magnevist))

