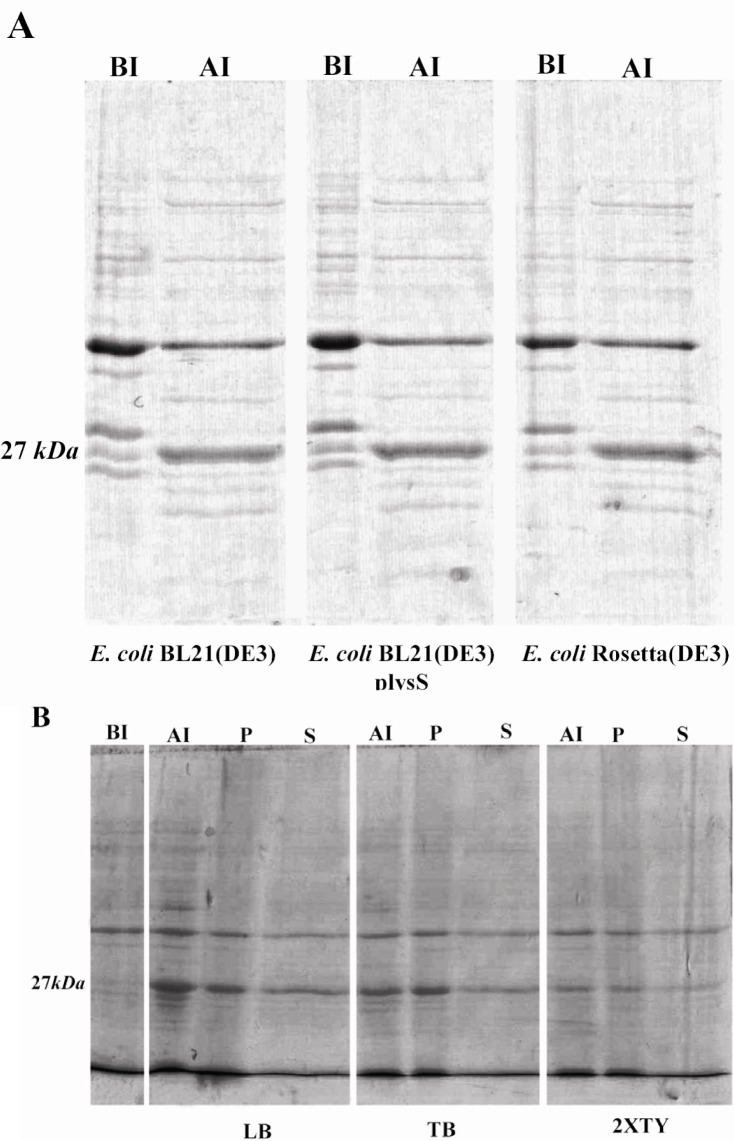
Figure 1.
SDS-PAGE analysis of expression of TGRA8 in E.coli. A) Expression level of TGRA8 in three different E.coli strains. pET-28b(+)-TGRA8 construct was transformed into the E.coli BL21(DE3), BL21(DE3) plysS and Rosetta(DE3) cells and expression of TGRA8 was induced by addition of 0.1 mM IPTG. SDS-PAGE analysis showed the expression of an approximately 27 kDa protein in induced bacteria (AI) which was absent in uninduced bacteria (BI). The expression level of the recombinant protein seemed to be equal in the three bacterial strains. B) Expression level and solubility of TGRA8 in three different culture media. Recombinant Rosetta(DE3) bacteria were cultured in LB, TB and 2XTY culture media and expression of TGRA8 was induced. SDS-PAGE analysis showed that the highest expression level was achieved in cells cultured in LB medium. The soluble and insoluble fractions of induced bacteria were analyzed on SDS-PAGE. Most of the recombinant protein was in insoluble form. However, considerable amount of the protein cultured in LB was soluble. BI) Total proteins of E.coli cells harbouring pET-28b(+)-TGRA8 before induction. AI) Total proteins after induction with 0.1 mM IPTG.

