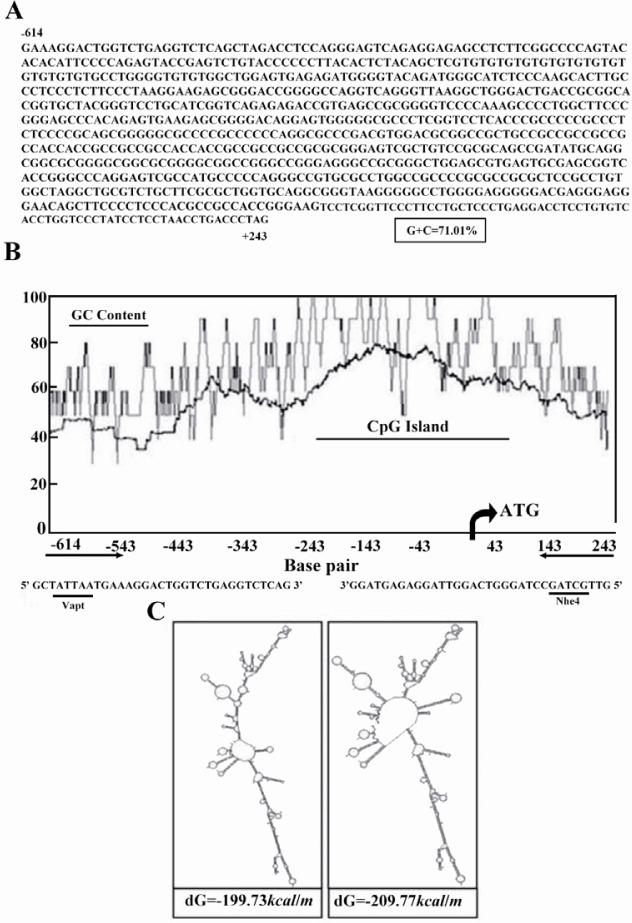
Figure 1.
DNA sequence, GC and CpG nucleotide composition graph of the putative promoter of PeP gene. A) Sequence of DNA fragment consisting of PeP gene (Accession no: NC_000070) putative promoter. The initiation codon is underlined. B) Genetyx software was used to plot the GC-graph and CpG plot programs (http://www.ebi.ac.uk/Tools/es/cgi-bin/jobresults.cgi/cpgplot/cpgplot-20100823-1343338151.html). Translation start site (TSS) is located at position +21 relative to the transcription start site. Primer sequences are shown below the graph. C) Two different secondary structures predicted graphs of target DNA based on the Mfold web server (http://mfold.bioinfo.rpi.edu/) for nucleic acid folding and hybridization prediction as noted in the Materials and Methods section. The internal energy required for formation of these constructs is indicated as kcal/mole

