Figure 2.
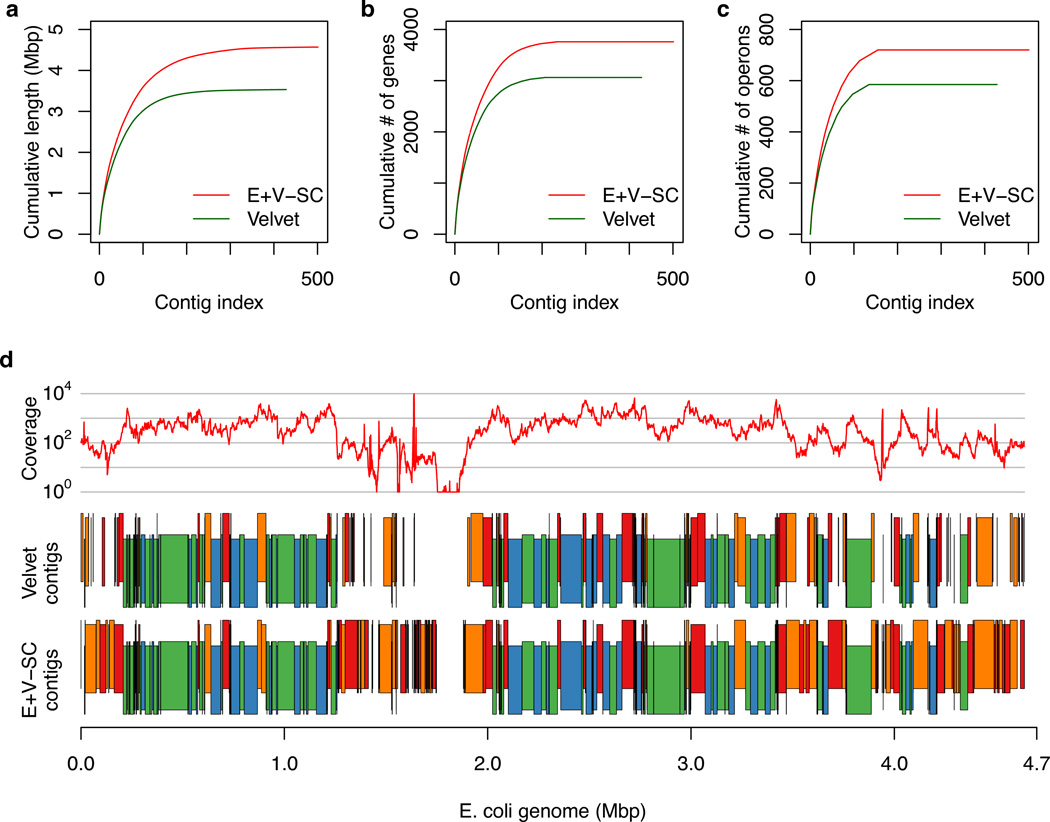
Comparison of contigs generated by Velvet vs. EULER+Velvet-SC for single cell E. coli lane 1. (a,b,c) Contigs are those presented in Table 1 and are ordered from largest to smallest number of bases. The y-axis shows (a) the cumulative length, (b) the cumulative number of genes, and (c) the cumulative number of operons in the contigs. EULER+Velvet-SC improves upon Velvet in all three plots. (d) Average read coverage over a 1000 bp window (top, log scale), Velvet contigs (middle) and EULER+Velvet-SC contigs (bottom), mapped along the E. coli reference genome, with vertical staggering to help visualize small contigs. Contigs in blue or green match between the assemblies. Contigs in red or orange differ between the assemblies: they either have substantially different lengths, are broken into a different number of contigs, or are present in one assembly but missing in the other.

