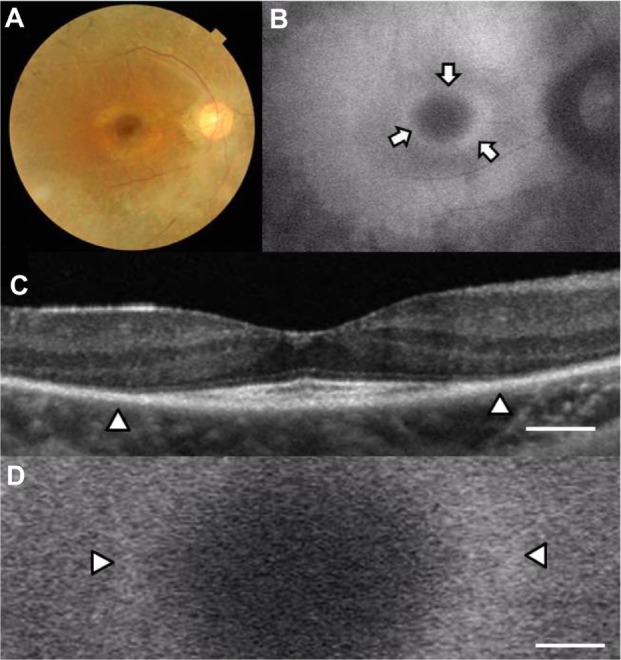
Figure 1.

Fundus images of the right eye in case 1. Color fundus photograph (A), short-wave length fundus autofluorescence photograph (B), spectral-domain optical coherence tomographic image (C), and magnifed fundus autofluorescence photograph of the macula (D). Arrows show a parafoveal high-density fundus autofluorescence ring (B). Arrowheads show the border of the external limiting membrane and the inner segment and outer segment line (C) and parafoveal high-density fundus autofluorescence ring (D). Bar = 200 μm (C and D).
