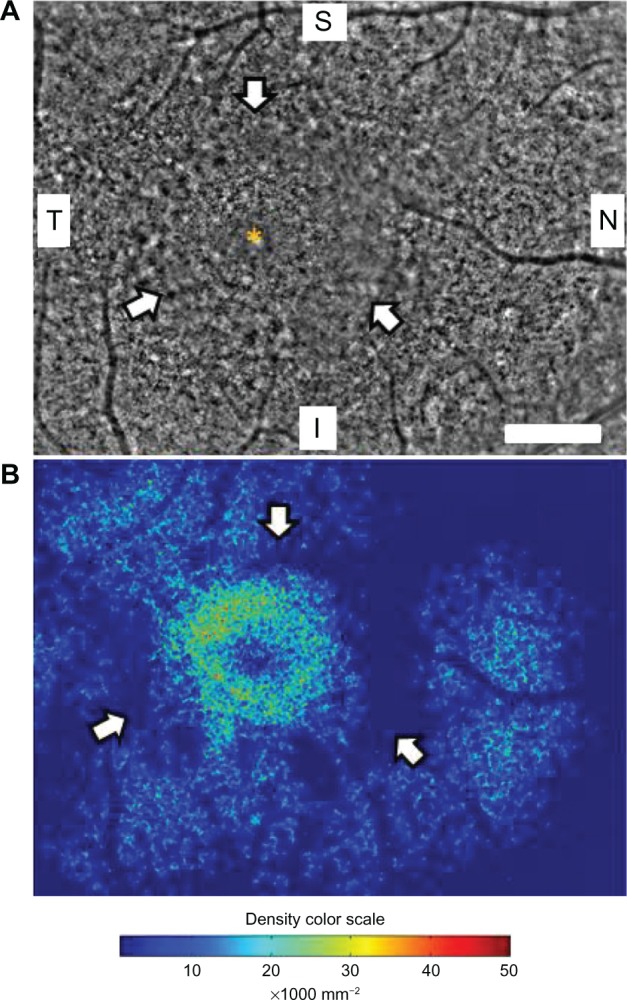
Figure 2.

Panoramic adaptive optics fundus image (A) and cone density map (B) of the right eye in case 1. (A) Panoramic adaptive optics fundus image 2.42 × 3.16 mm in area including the fovea (yellow asterisk). Arrows show a blurred ring area of cone mosaics which corresponds to the parafoveal high-density fundus autofluorescence ring. Bar = 200 μm (A). (B) Panoramic cone density map of the same area as in (A).
Notes: Arrows show a ring of low density area which corresponds to the blurred area in the adaptive optics image. Arrowheads show focal high density areas of cone photoreceptors. The color scale of the density is shown.
Abbreviations: S, superior; i, inferior; N, nasal; T, temporal.
