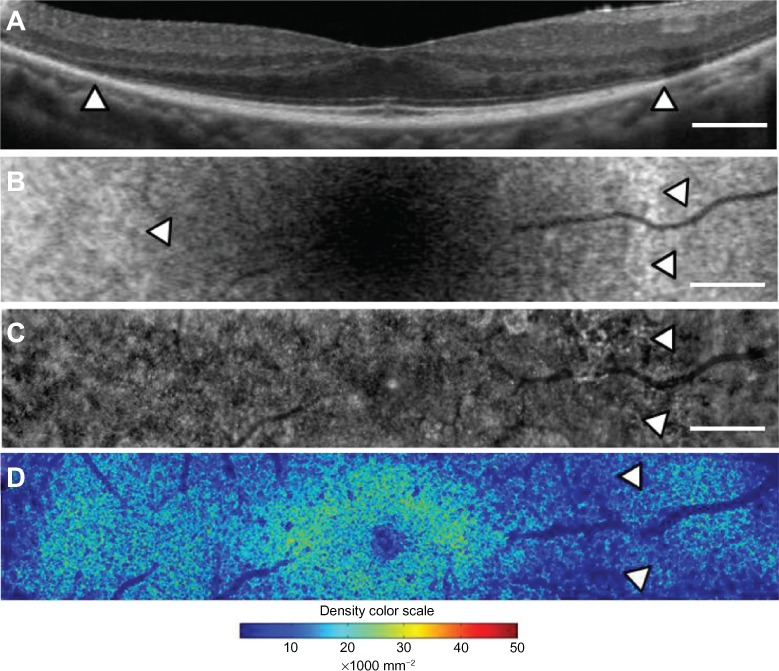
Figure 6.

Macular images of OCT (A), fundus autofluorescence (B), adaptive optics (C), and the panoramic cone density map (D) of the right eye in case 2. The OCT image shows the border of the inner segment and outer segment line and the external limiting membrane at the arrowheads (A). Magnifed fundus autofluorescence image of the macula shows part of the high-density fundus autofluorescence ring at the nasal retina [arrowheads in (B)]. The temporal inner border of the ring is indicated by an arrowhead (B). The adaptive optics panoramic image of a 5.9 × 1.1 mm area appears as a blurred region with some dark patchy areas at the nasal side of the high-density fundus autofluorescence ring (arrowheads in C). A panoramic cone density map of the same area as in (C) shows low densities at the nasal ring [arrowheads in (D)]. Bar = 200 um (A-C).
Note: The color scale of the density is shown.
Abbreviation: OCT, optical coherence tomography.
