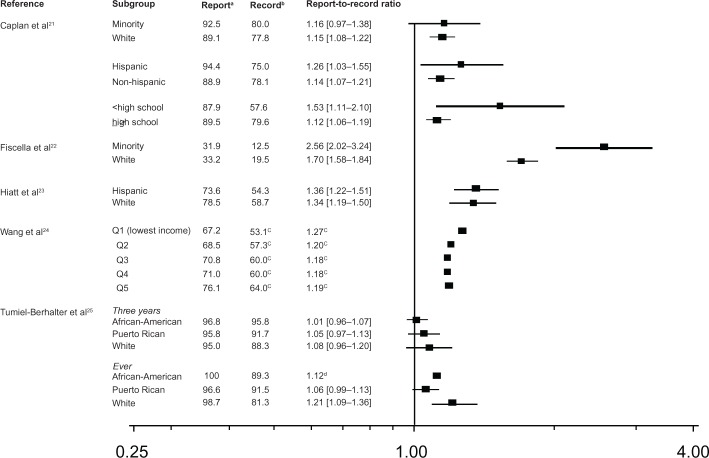
Figure 1.
Report-to-record ratios by study and comparison groups.
Notes:aPercentage of women who reported a Pap test during the outcome time frame; bpercentage of women who had a Pap test recorded during the outcome time frame; csample size not provided; therefore unable to calculate confidence intervals; dunable to calculate confidence intervals due to lack of convergence.

