
Figure 5.
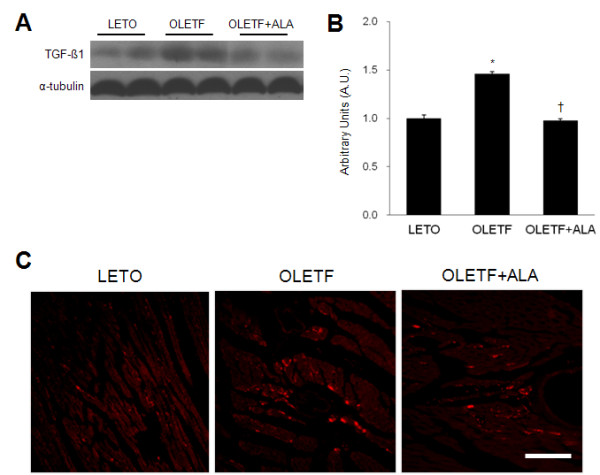
Effect of ALA on cardiac TGF-β1 and CTGF expression in OLETF rats. (A) A Western blot showing the level of cardiac TGF-β1 in each group. (B) Quantification of cardiac TGF-β1 by Western blot analysis. The densitometry value of each protein was normalized to that of α-tubulin and the values are presented as arbitrary units (A.U.) relative to LETO expression levels. Data are presented as the mean ± SEM. *p < 0.05 vs. LETO rats; †p < 0.05 vs. OLETF rats. (C) Representative micrographs of immunostained CTGF in the hearts from each group. Scale bar = 100 μm.