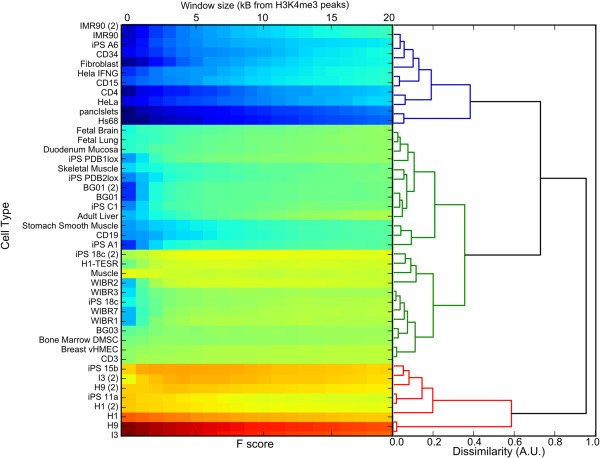
Figure 3.
Hierarchical cluster analysis of the HERV-H/H3K4me3 F score, as a function of the window size (horizontal axis). F score is represented using the color scale as in Figure 2. The highly associated cluster (red tree) was made of human ES and iPS cells. The cluster with medium association (green) consisted of mesenchymal stem cells (DMSC), fetal lung and brain cells, and some iPS cells, with F scores that were barely significant. The blue cluster consisted of differentiated cells and the mean F score of 0.36 was insignificant.

