
Figure 8.
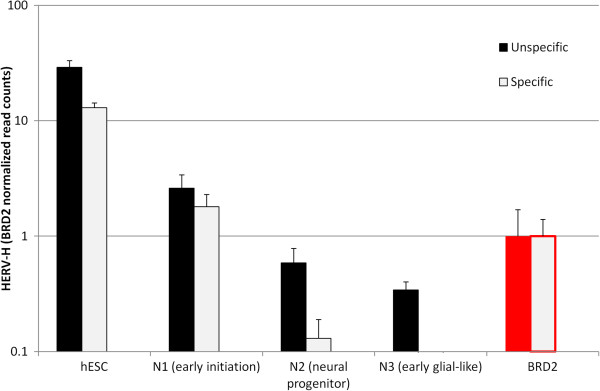
HERV-H expression correlates with differentiation status. HERV-H expression as H1 human ES cells differentiate down a pathway towards neural progenitors and early glial cells. Black bars indicate unspecific expression; white bars represent specific expression, adjusted for expression as described in Figure 7. BRD2 has the same expression level at each stage of differentiation and was used to normalize HERV-H RNA levels.