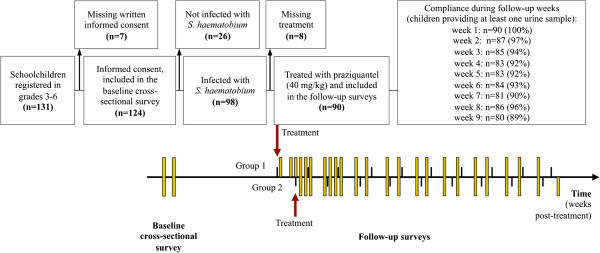
Figure 1.

Timeline of a study assessing the dynamics of S. haematobium egg output and associated infection parameters after praziquantel treatment, among school-aged children in south Côte d’Ivoire in 2010. Flow chart showing the number of children invited to participate in the study, the children included in the baseline screening, and finally the overall compliance of children participating in the 62-day longitudinal surveillance to measure the dynamics of S. haematobium egg output and associated infection parameters after a single oral dose of praziquantel (40 mg/kg). The timeline shows the frequency of urine sampling (yellow bars) during the follow-up survey with the maximum number of urine samples collected per child during each follow-up week after treatment.
