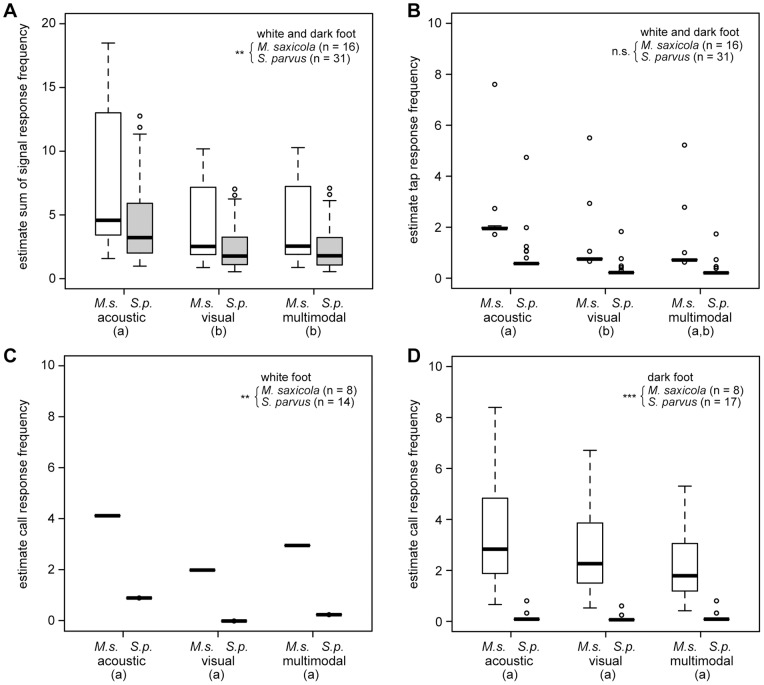
Figure 4. Comparison of response frequency of signal behaviors of Micrixalus saxicola .
(M.s) and Staurois parvus (S.p) between acoustic, visual or multimodal stimuli. (A) sum (call, tap and foot flag) response of white and dark foot playback presentations; (B) tap response of white and dark foot playback presentations; call response of (C) white foot and (D) dark foot playback presentations. Box plots show the estimated mean individual value with interquartile range, 10th and 90th percentile and minimum and maximum values, o designate outliners. Statistical significant response frequency differences between species are denoted by asterisk (** P<0.01; *** P<0.001), between stimuli the values without the same superscript letter (a, b) differ significantly at (A) P<0.001 and (B) P<0.05 (also see Table 2).

